Forex
Weighted Moving Average (WMA): Calculation and Interpretation
Written by Nathalie Okde
Fact checked by Rania Gule
Updated 16 December 2024

Table of Contents
The weighted moving average (WMA) is a technical analysis indicator that helps traders determine market trends, identify reversals, and filter market noise.
This article explains how to calculate and interpret the WMA correctly.
Key Takeaways
-
The WMA gives more importance to recent prices, allowing traders to respond to market changes quickly.
-
It is especially useful for short-term trading, where capturing the latest trends is crucial.
-
The WMA can act as a dynamic support or resistance level, helping traders identify key entry and exit points.
-
Despite its advantages, the WMA’s sensitivity can sometimes produce false signals, particularly in volatile markets.
Try a No-Risk Demo Account
Register for a free demo and refine your trading strategies.
Open Your Free Account
What is the Weighted Moving Average (WMA)?
The Weighted Moving Average (WMA) is a type of moving average used in technical analysis that assigns different weights to each data point within a specified period.
This moving average places more weight on the most recent prices, making it more responsive to new information.
The WMA approach helps traders understand the current trend by emphasizing the most relevant data points.
How to Calculate the Weighted Moving Average
To calculate the Weighted Moving Average, you multiply each price point by a predetermined weight and then sum these values. The most recent prices get the highest weights, while older prices get lower weights.
This weighted sum is then divided by the sum of the weights to produce the WMA.

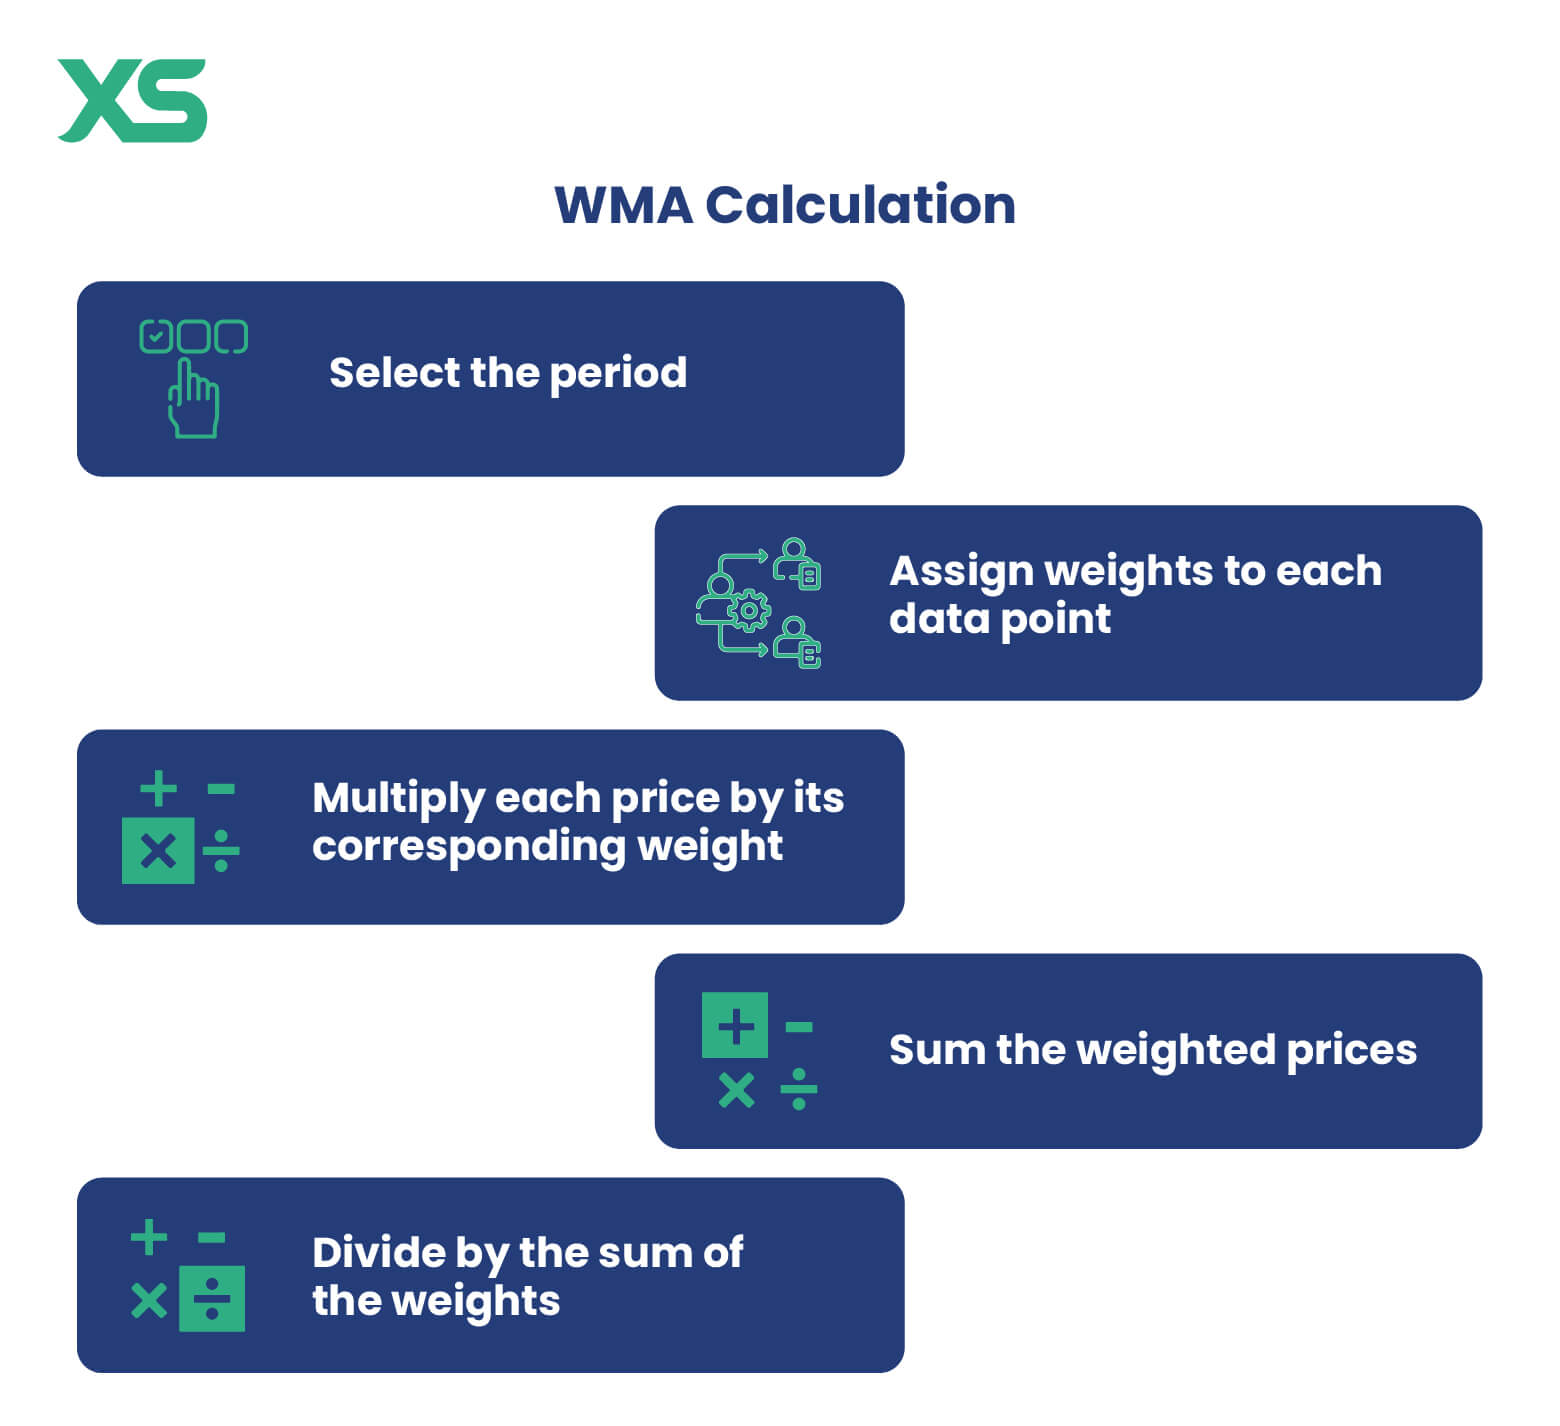
Here’s the WMA calculation step by step:
-
Select the period: Decide the number of periods you want to include in the WMA calculation.
For example, if you choose a 5-day WMA, you will calculate the average based on the prices of the last five days. -
Assign weights to each data point: The most recent data point receives the highest weight, and the weights decrease as you go further back in time.
For a 5-day WMA, the weights might be 5 for the most recent day, 4 for the day before that, and so on, down to 1. -
Multiply each price by its corresponding weight: Multiply the closing price of each day by its assigned weight.
-
Sum the weighted prices: Add up all the weighted prices from step 3.
-
Divide by the sum of the weights: The final step is to divide the sum of the weighted prices by the sum of the weights.
WMA Formula
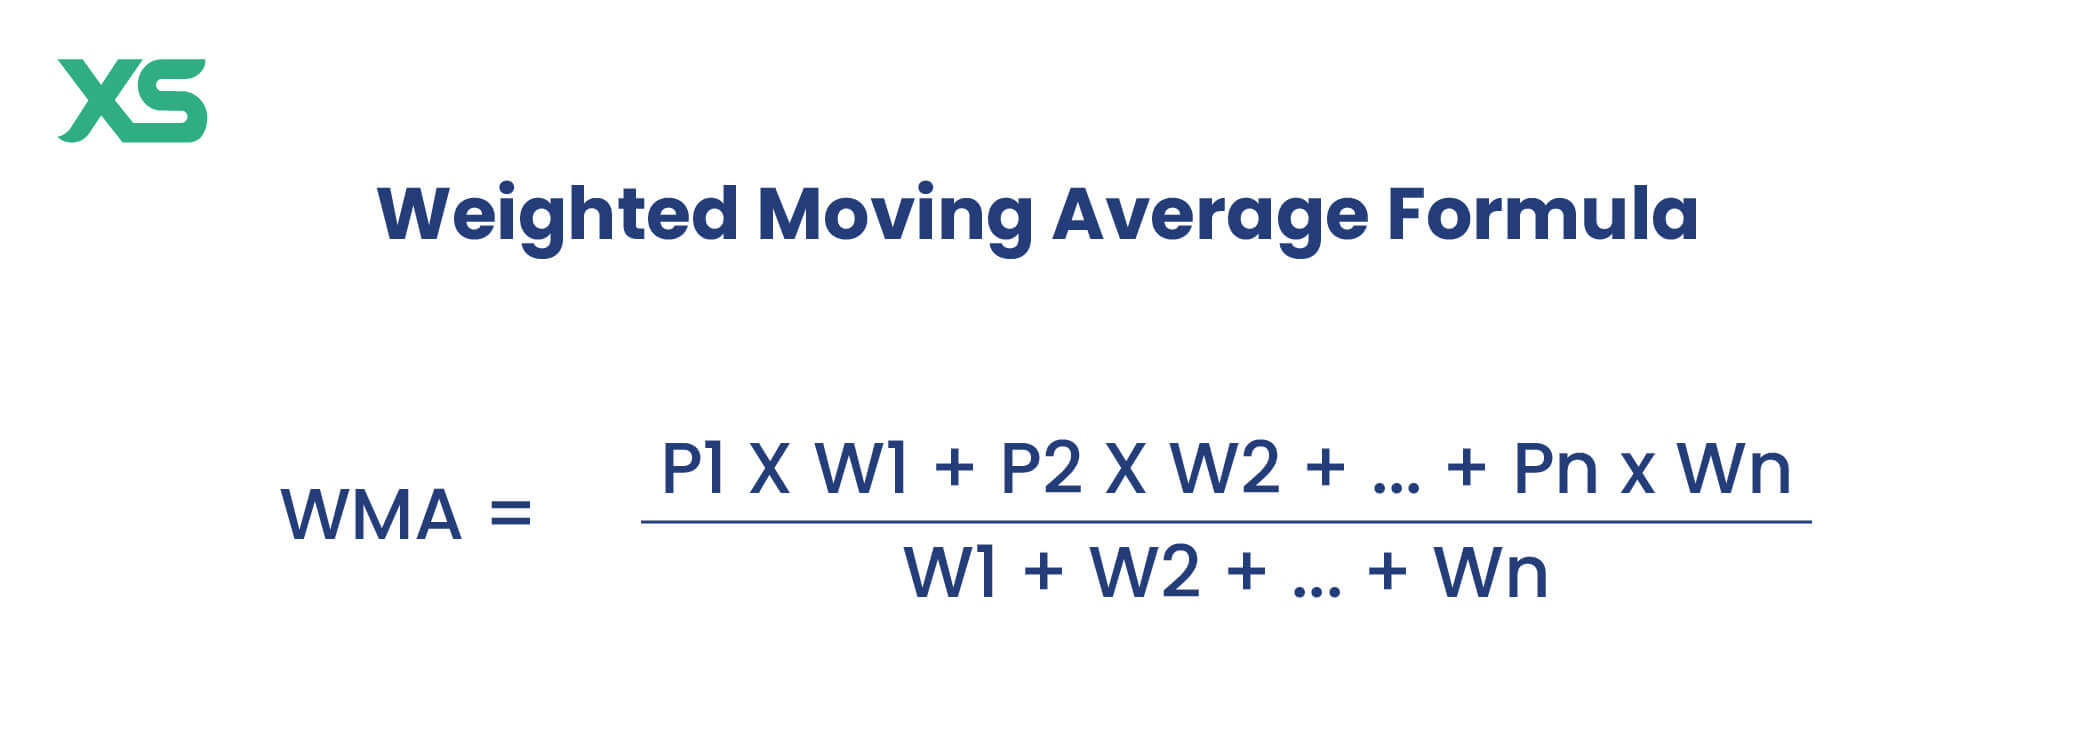
The Weighted Moving Average formula is:

Where:
-
P1, P2, ... are the prices for each day in the period.
-
W1, W2,... are the corresponding weights for each price, with the most recent price having the highest weight.
Weighted Moving Average Example Calculation
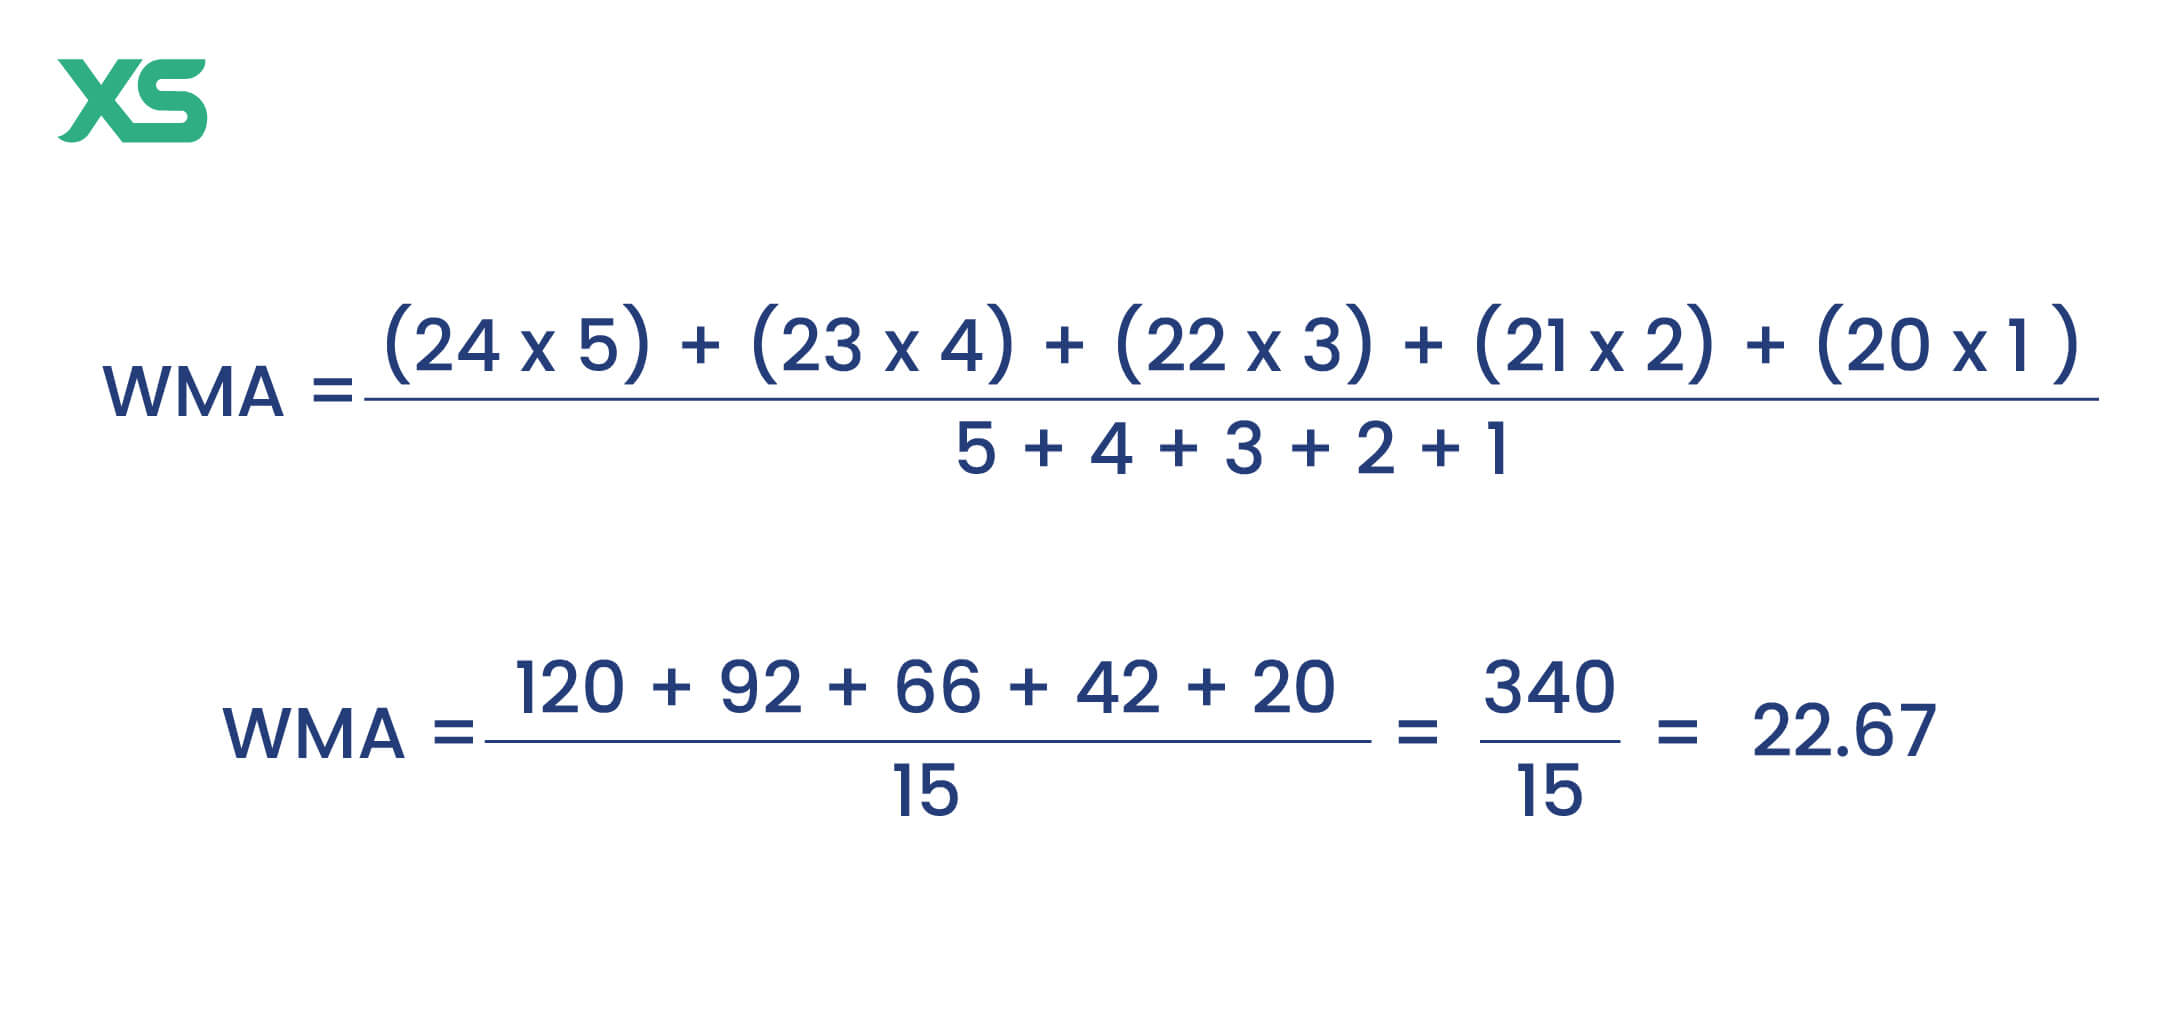
If you are calculating a 5-day WMA, the weights might be 5, 4, 3, 2, and 1, and the prices for the last five days might be $20, $21, $22, $23, and $24.
Therefore, using the WMA formula is:

So, the 5-day WMA would be 22.67.
This calculated WMA value would then be plotted on a chart to help traders analyze trends and make informed decisions.
Comparison of Moving Averages
Moving averages come in various forms, each with its unique characteristics.
Understanding these differences can help you choose the most suitable moving average for your trading strategy.
Simple Moving Average vs. Weighted Moving Average
The Simple Moving Average (SMA) and the Weighted Moving Average (WMA) both simplify price data to identify trends. However, they do so differently.
Let's explore the SMA vs VMA differences:
-
SMA: Equally weighs all data points, effectively smoothing trends but may lag behind recent market changes.
-
WMA: Prioritizes recent data, making it more responsive to price shifts and delivering quicker signals.
Exponential Moving Average vs. Weighted Moving Average
Both the Exponential Moving Average (EMA) and the Weighted Moving Average (WMA) are designed to give more significance to recent price data, but they use different methods.
Let's explore the EMA vs VMA differences:
-
EMA: Uses exponentially decreasing weights on older prices, making it highly responsive to recent market changes.
-
WMA: Employs a simpler linear weighting system, which still emphasizes recent prices but is slightly less responsive than the EMA.
What Is the Difference Between a Moving Average and a Rolling Average?
The terms Moving Average and Rolling Average are often used interchangeably, but there is a subtle difference.
-
Moving Average: Calculates the average of a specific number of data points, adjusting as it progresses through the data series.
-
Rolling Average: Often synonymous with moving average, but can also describe an average that continuously updates, providing ongoing smoothing over time.
What is a Triangular Moving Average?
The Triangular Moving Average (TMA) is a more advanced type of moving average that applies double smoothing to the data, emphasizing the middle portion of the data series.
This results in a much smoother trend line, which can be particularly useful in markets with high volatility.
The TMA reduces the impact of extreme highs and lows, making it easier to identify the underlying trend by filtering out short-term noise.
What Is a Double Exponential Moving Average?
The Double Exponential Moving Average (DEMA) is an advanced version of the Exponential Moving Average. It involves applying the EMA calculation twice, significantly reducing the lag associated with traditional moving averages.
The DEMA responds more quickly to price changes, making it a valuable tool for traders making quick decisions based on the most recent market data.
Its ability to minimize lag while still smoothing out price data makes it an attractive option for those looking for more immediate trend signals.
What Is the Difference Between a Moving Average and a Rolling Average?
A moving average calculates the average of a fixed number of recent data points, updating as new data becomes available, commonly used in technical analysis.
A rolling average, while similar, is a broader term that refers to continuously updating averages in any data series, often applied in various fields beyond finance.
Which Moving Average Is Best?
The best moving average depends on your trading goals. Simple Moving Averages (SMAs) are ideal for long-term trend analysis due to their stability.
However, Weighted (WMAs) and Exponential Moving Averages (EMAs) are better for short-term trading, as they respond more quickly to recent price changes.
EMAs are the fastest but can generate false signals in volatile markets, making WMAs a balanced option for smoother yet responsive trends. Your choice should align with your strategy and market conditions.
How to Use WMA in Trading
Now that you know how to calculate the weighted moving average, here’s how to interpret and use the result in your trading strategies.

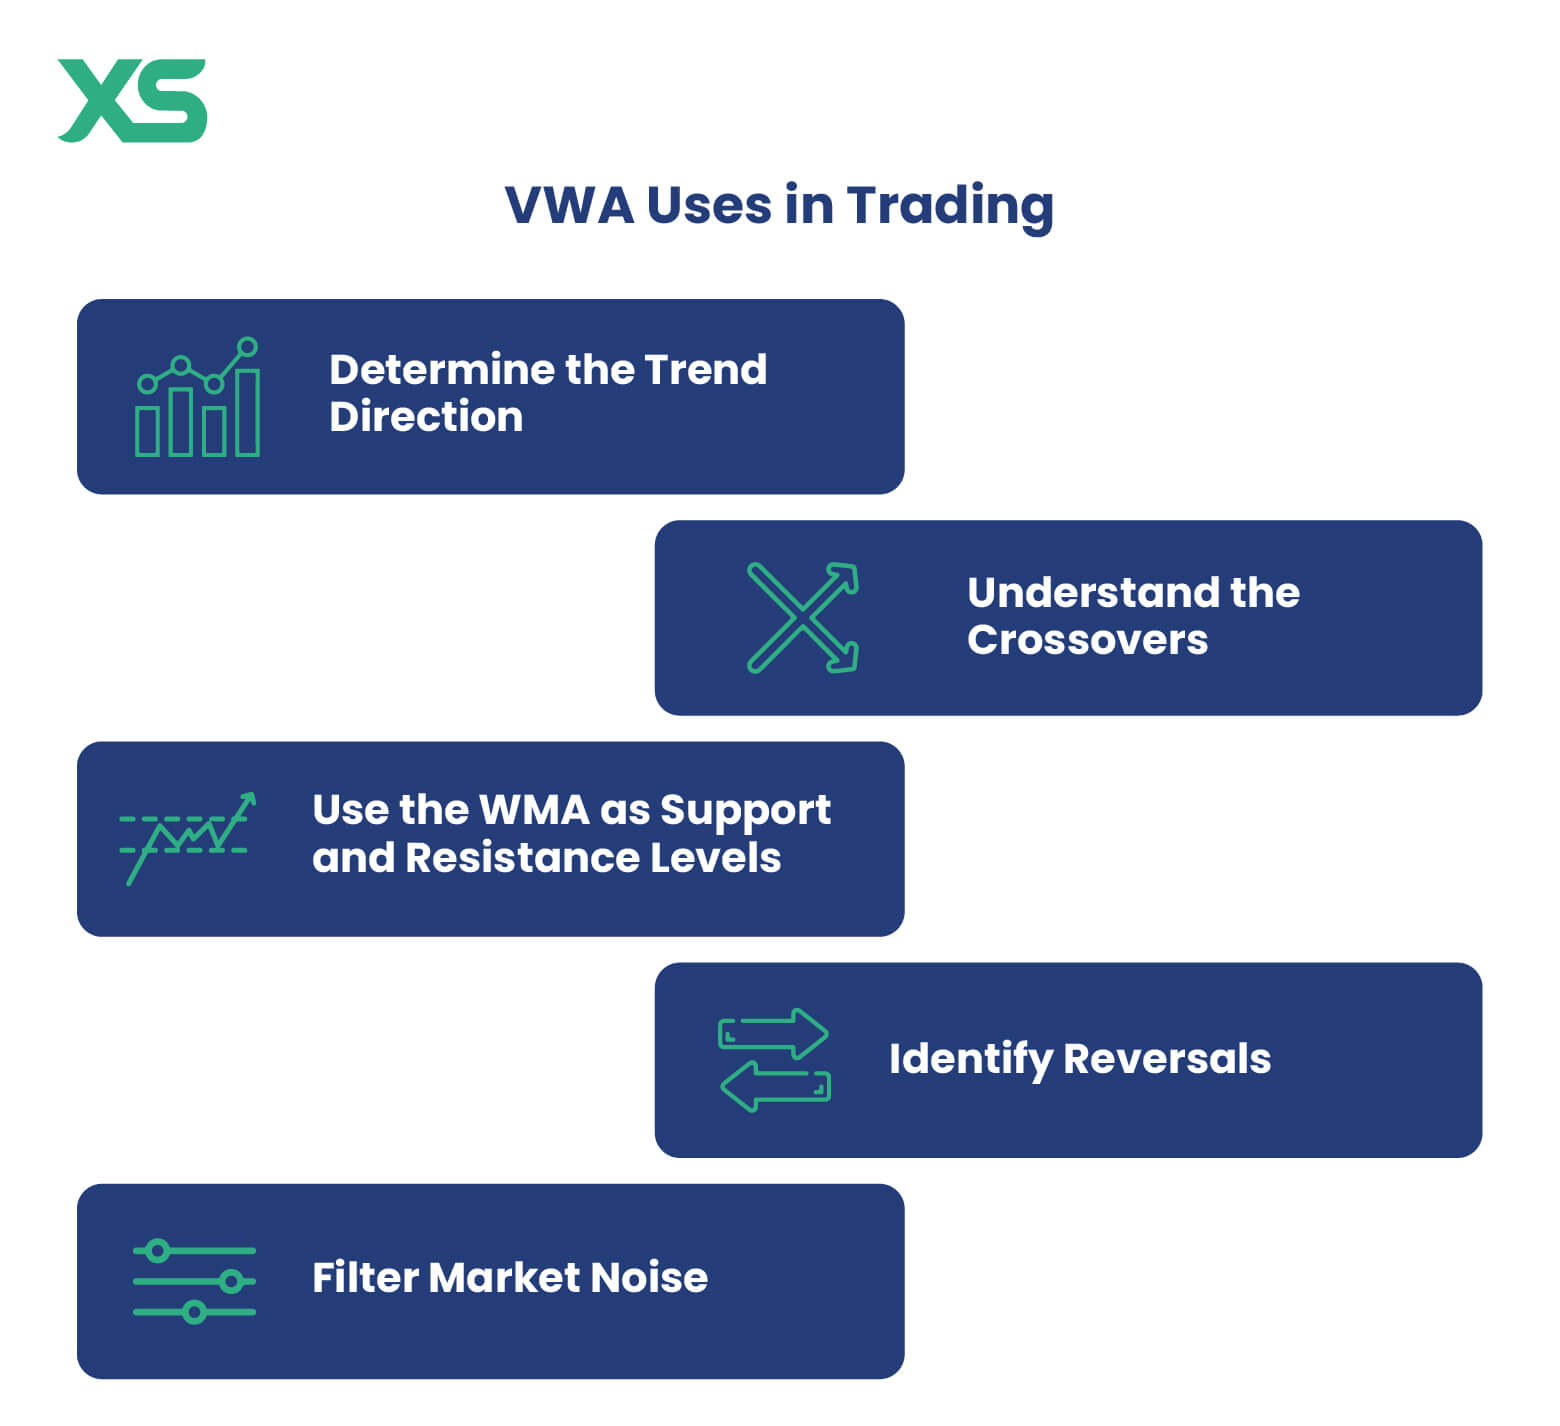
Determine the Trend Direction
The weighted moving average can help you determine the trend direction.
-
Uptrend: If the WMA is rising, it suggests that the prices are trending upwards. This means the recent prices are consistently higher than the previous ones, indicating a bullish market.
-
Downtrend: If the WMA is falling, it indicates that prices are trending downwards, with recent prices lower than previous ones, signaling a bearish market.
The steepness of the WMA's slope can also give clues about the trend's strength. A steeper slope suggests a stronger trend, while a flatter slope indicates a weakening trend.
Understand the Crossovers
When the price crosses above the WMA indicator, it could signal a buying opportunity, as it may indicate the start of an upward trend.
On the other hand, when the price crosses below the WMA, it could be a signal to sell, as it might indicate the start of a downward trend.
Moreover, traders often use multiple WMAs with different periods (e.g., a short-term WMA and a long-term WMA).
-
When the shorter-term WMA crosses above the longer-term WMA, it's called a "golden cross," often viewed as a bullish signal.
-
When the shorter-term WMA crosses below the longer-term WMA, it's known as a "death cross," typically seen as a bearish signal.
Use the WMA as Support and Resistance Levels
The WMA can act as a dynamic support or resistance level.
-
In an uptrend, the WMA often serves as a support level, where prices tend to bounce off.
-
In a downtrend, it may act as a resistance level, where prices struggle to break above.
Observing how prices interact with the WMA can help traders identify potential entry or exit points.
Identify Reversals
The weighted moving average (WMA) can help indicate a potential trend reversal in the below cases:
-
If the price is making new highs while the WMA fails to make new highs
-
If the price is making new lows while the WMA isn’t confirming the new lows
Moreover, when the WMA flattens out after a significant uptrend or downtrend, it might signal that the current trend is losing momentum, and a reversal or sideways movement could be on the horizon.
Filter Market Noise
The WMA can help filter out short-term price fluctuations or "noise," giving traders a clearer view of the underlying trend.
By focusing on the WMA, traders can avoid being misled by minor price movements that don’t reflect the true direction of the market.
Common Mistakes in WMAs
Common mistakes when using Weighted Moving Averages (WMAs) often stem from their sensitivity to recent price changes.
While this responsiveness can be useful, it also increases the risk of false signals in volatile markets, especially if not paired with other indicators like RSI or Bollinger Bands.
Another error is selecting an unsuitable timeframe, short periods can cause excessive noise, while longer ones may lag behind rapid market movements.
Relying solely on WMAs without considering the broader market trend or overloading charts with conflicting indicators further reduces their effectiveness. Avoiding these pitfalls ensures more accurate and reliable trading decisions.
Advantages of WMA
The weighted moving average can be very beneficial for traders:
-
The Weighted Moving Average is highly sensitive, allowing it to respond quickly to recent price changes.
-
It is particularly effective for short-term trading, capturing short-term trends more accurately.
-
The WMA reduces lag by focusing on recent data and providing more up-to-date signals.
-
This method offers timely trading signals, making it more effective in dynamic market conditions than simpler moving averages.
Limitations of the Weighted Moving Average
Despite its advantages, the weighted moving average indicator has its limitations:
-
The increased sensitivity of the WMA can lead to more false signals, especially in volatile markets.
-
Its calculation is more complex than that of the Simple Moving Average, which might make it less accessible for some traders.
-
The WMA’s heightened responsiveness may not offer significant advantages in stable or low-volatility markets.
-
The WMA may sometimes place too much emphasis on recent data, potentially overlooking longer-term trends.
Conclusion
Therefore, the weighted moving average (WMA) is an important indicator to incorporate into your trading strategies.
Whether you’re trading stocks, forex, or commodities, the WMA can enhance your trading strategy by providing timely signals.

Get the latest insights & exclusive offers delivered straight to your inbox.
Table of Contents
FAQs
The choice between EMA and WMA depends on your trading style. The EMA reacts more quickly to recent price changes, while the WMA provides a smoother trend line.
Both have advantages, and the best one depends on your specific needs.
Yes, the WMA is a good indicator, especially for traders who want to capture short-term trends. Its ability to emphasize recent data makes it a reliable tool in various market conditions.
The primary difference is that the WMA prioritizes recent prices, making it more sensitive to current market conditions than the simple moving average, which treats all prices equally.
The main advantage of the WMA is its responsiveness to recent price changes, allowing traders to detect trends and reversals more quickly.
There is no one-size-fits-all answer. The best moving average for trading depends on your goals. The WMA is ideal for those looking for a more responsive indicator, while the SMA and EMA each have their own strengths in different trading scenarios.
This written/visual material is comprised of personal opinions and ideas and may not reflect those of the Company. The content should not be construed as containing any type of investment advice and/or a solicitation for any transactions. It does not imply an obligation to purchase investment services, nor does it guarantee or predict future performance. XS, its affiliates, agents, directors, officers or employees do not guarantee the accuracy, validity, timeliness or completeness of any information or data made available and assume no liability for any loss arising from any investment based on the same. Our platform may not offer all the products or services mentioned.


