Forex
Volume Profile Trading: What It Is and How to Trade It?
By Sarah Abbas
30 August 2024

Volume Profile is a charting tool that displays the volume of trades executed at specific price levels over a given period.
This tool helps traders understand where significant trading occurs. This article will explore the components, importance, and strategies for effectively using Volume Profiles in your trading strategy.
Key Takeaways
-
Volume Profile is a charting tool that shows the volume of trades executed at various price levels over a specific period.
-
Volume Profile identifies key support/resistance levels and market sentiment, crucial for making informed trading decisions.
-
High-Volume Node retracements and Low-Volume Node breakouts are key strategies, with time frames adjusted to your trading style.
What Is Volume Profile?
Volume Profile is a charting tool that helps traders analyze the volume of trades performed at various price levels over a specific timeframe.
Unlike traditional volume indicators that show volume per unit of time, the Volume Profile indicator provides a horizontal representation of volume, which helps traders see where the most trading activity occurs at various price points.
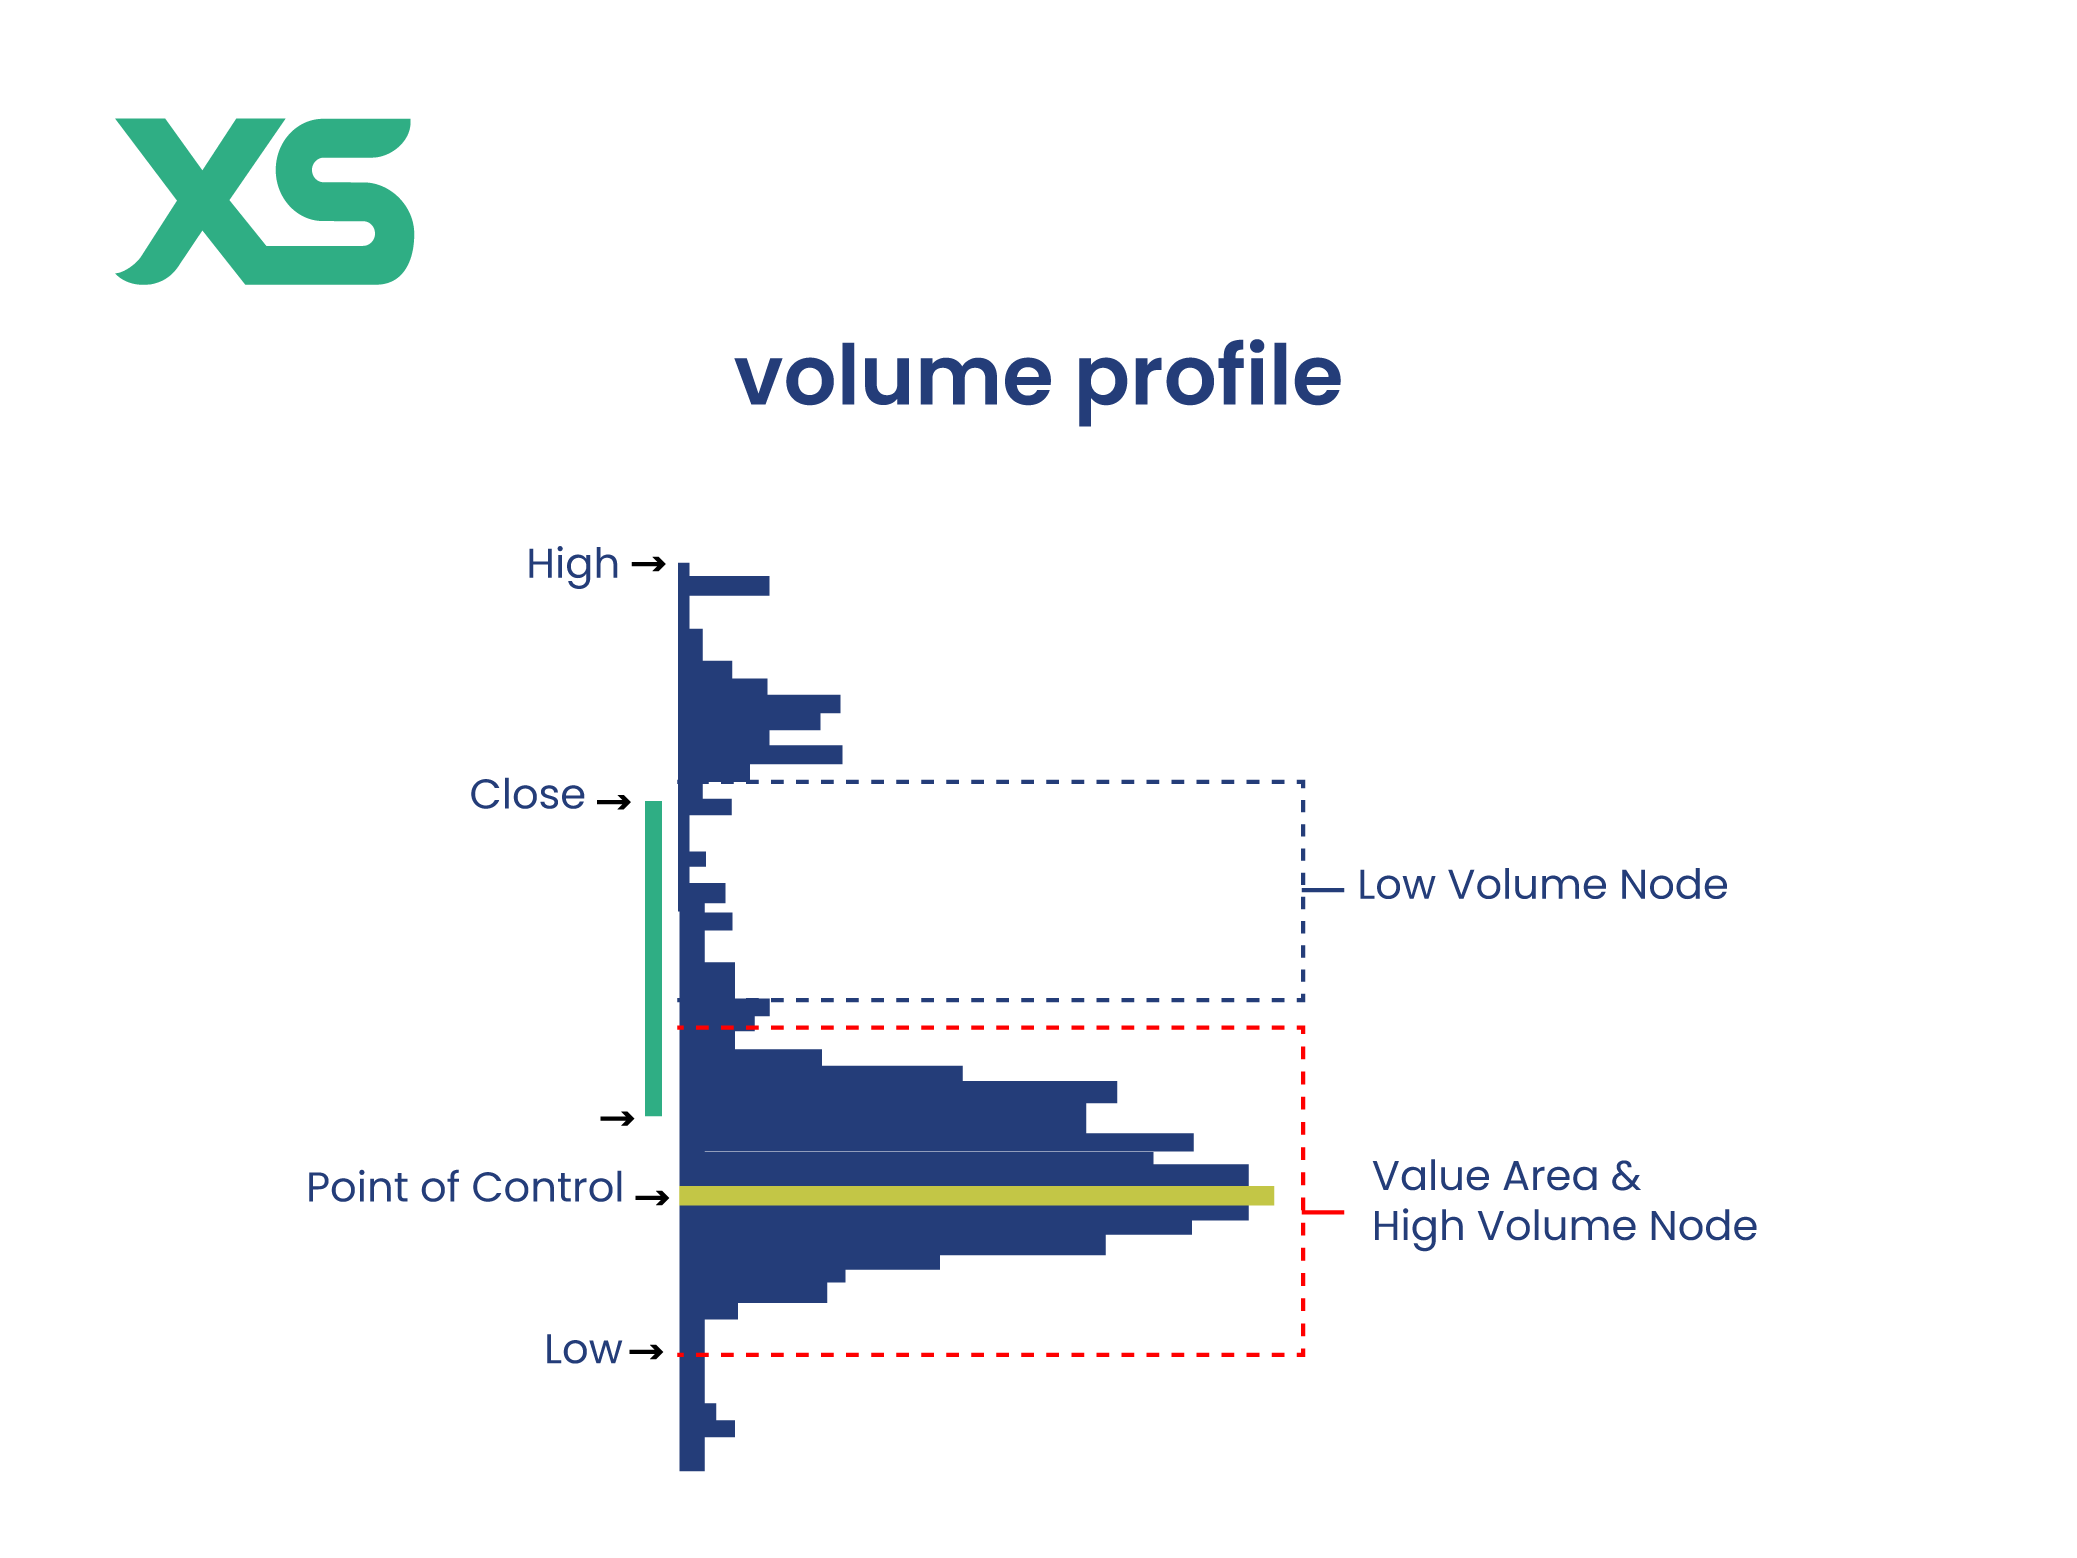
Volume Profile Components
To effectively use the Volume Profile trading strategy, it's essential to understand its key components:
-
Price Levels: The horizontal axis of the Volume Profile chart represents different price levels, showing where trading activity occurs across a range of prices.
-
Volume Nodes: These are visual representations on the chart where high volumes of trades occurred. They can be categorized into:
-
High Volume Nodes (HVN): Areas with significant trading activity, indicating strong interest and likely areas of support or resistance.
-
Low Volume Nodes (LVN): Areas with minimal trading activity, often resulting in rapid price movement through these zones due to the lack of interest.
-
-
Point of Control (POC): This is the specific price level that experienced the highest traded volume during the selected period.
-
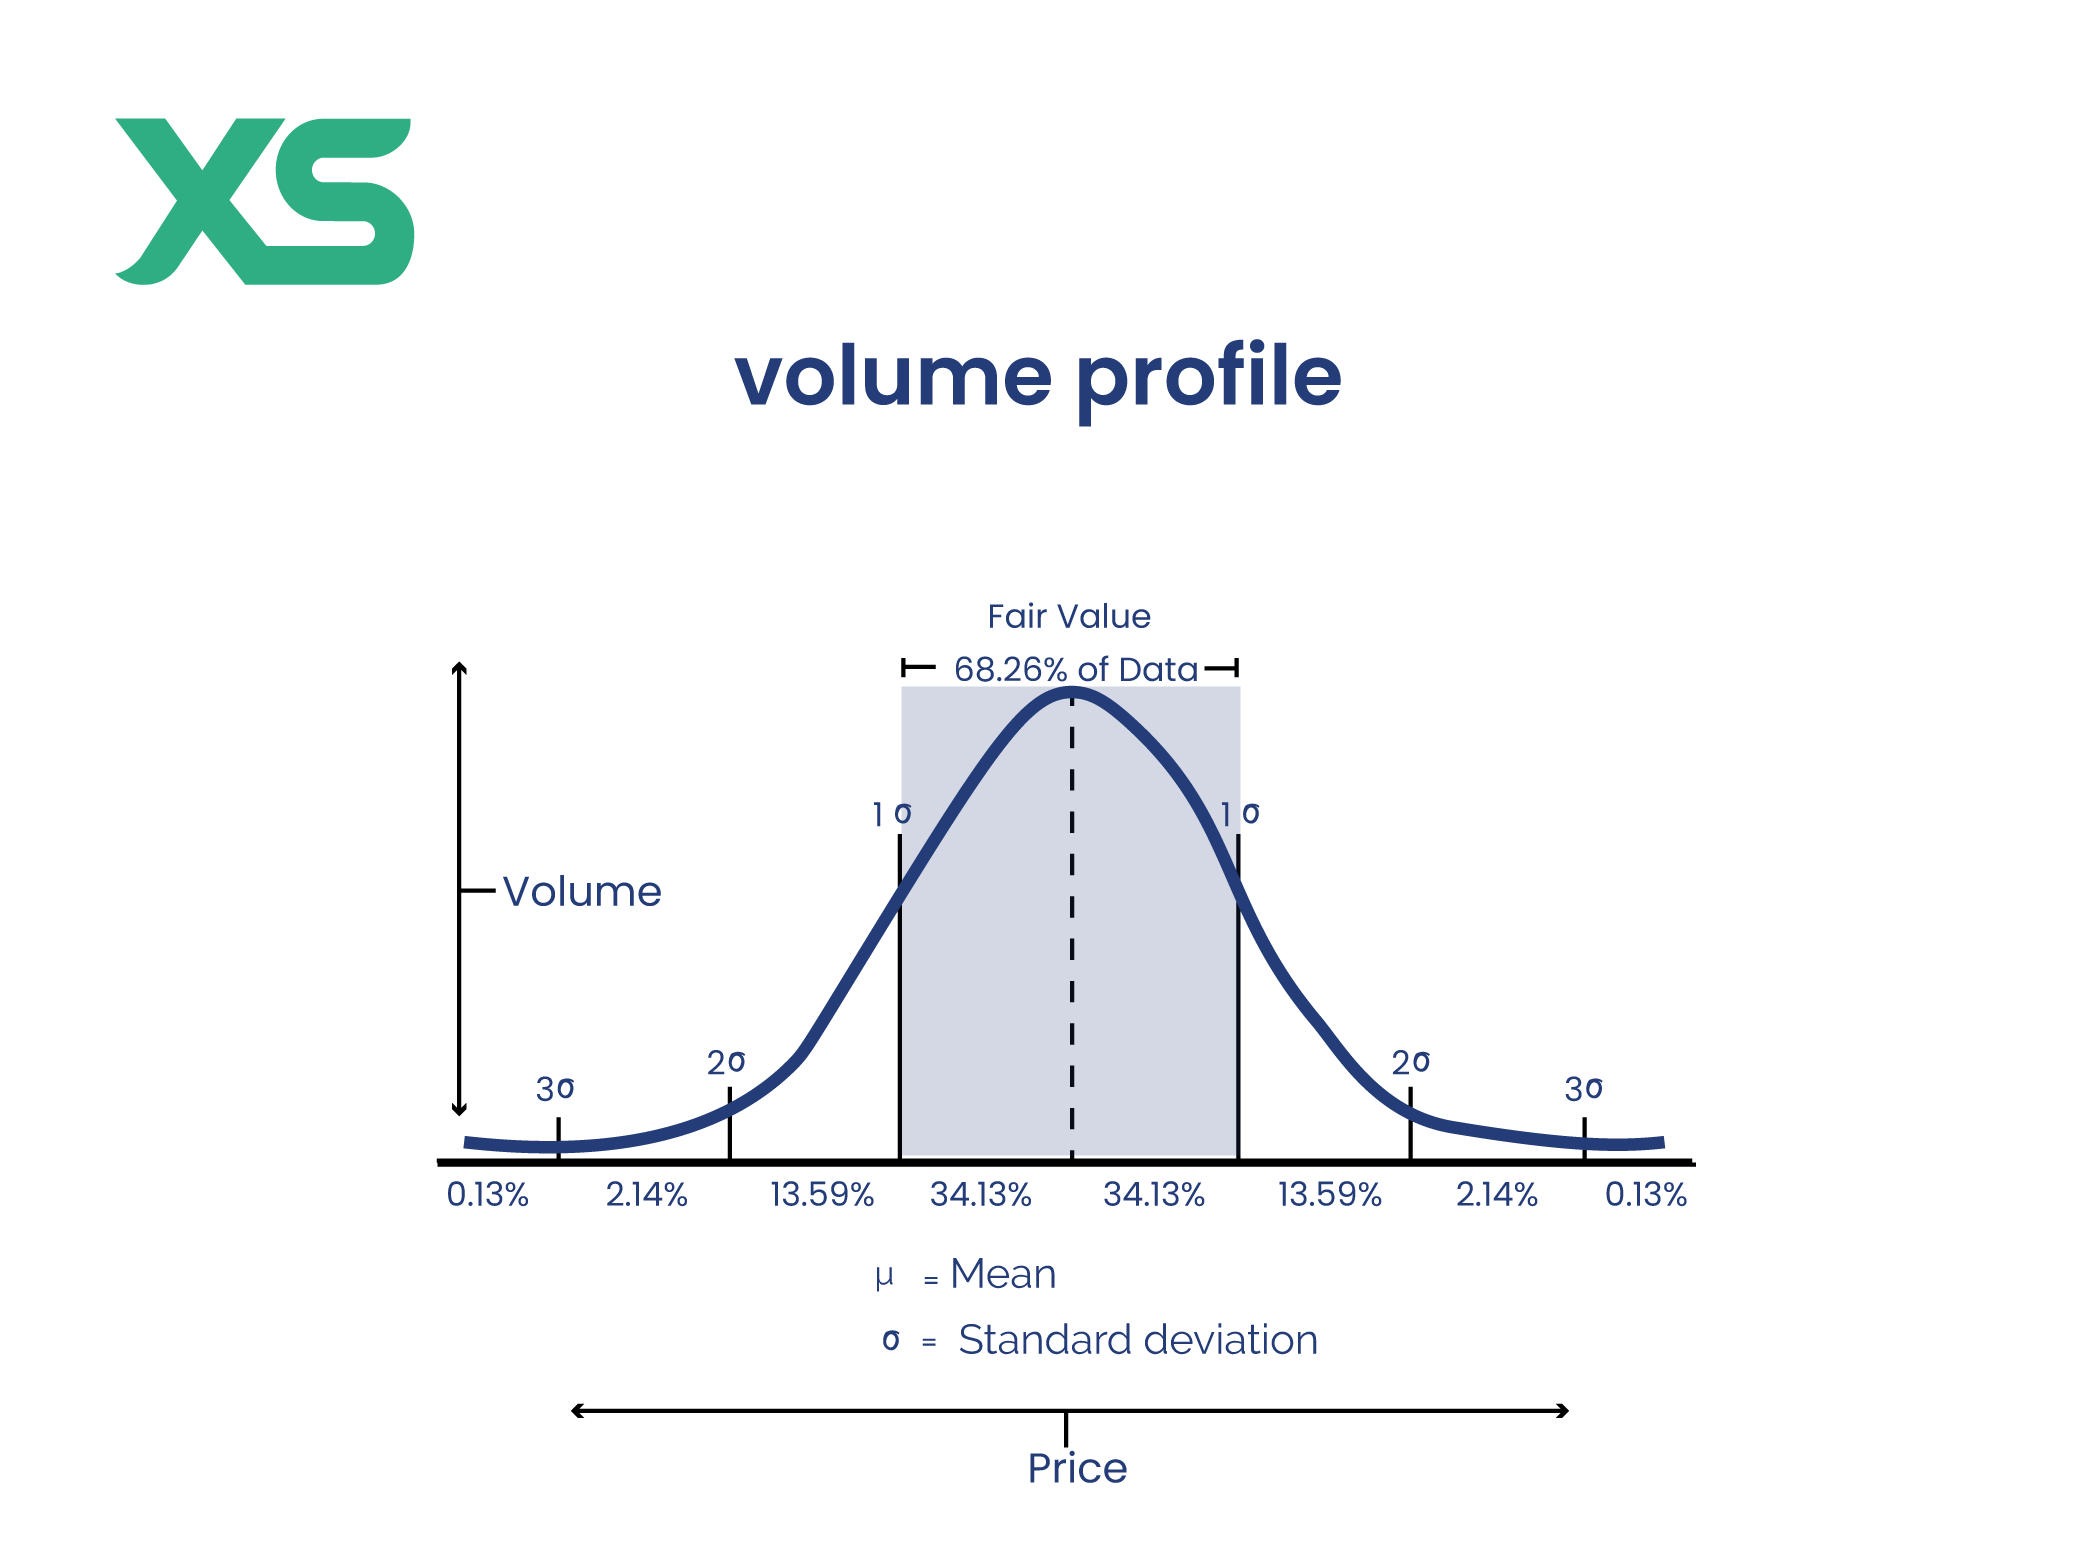
Value Area (VA): This represents the range of price levels where 70% of the volume was traded. The value area is crucial for identifying fair value zones where the market perceives a balance between buying and selling interest.
-
Volume Weighted Average Price (VWAP): This average price considers the volume traded at each price level, providing a more comprehensive understanding of market sentiment compared to a simple average price.
The Importance of Volume Profile
Volume Profile analysis helps identify key support and resistance levels, which are crucial for making entry and exit decisions.
Unlike traditional volume indicators, the Volume Profile indicator provides a clearer picture of market sentiment, showing where traders are most interested in buying or selling.
How Volume Profile Trading Works?
Volume Profile works by aggregating trade volume data at each price level to create a detailed visual representation of where trading activity is concentrated.
This process involves collecting and analyzing data from various trades to provide a clear picture of market sentiment and the levels at which traders are most active.
In addition, the volume profile doesn’t work the same in all markets. For example, volume data is not as straightforward for data aggregation in the decentralized forex market as in centralized markets like stock exchanges. Therefore, the Volume Profile indicator often relies on data from large liquidity providers or brokerages.
For visualization, the Volume Profile indicator visualizes this aggregated data on a chart, displaying it as a series of horizontal bars along the price axis.
Each bar represents the volume of trades executed at a specific price level over the chosen time frame.
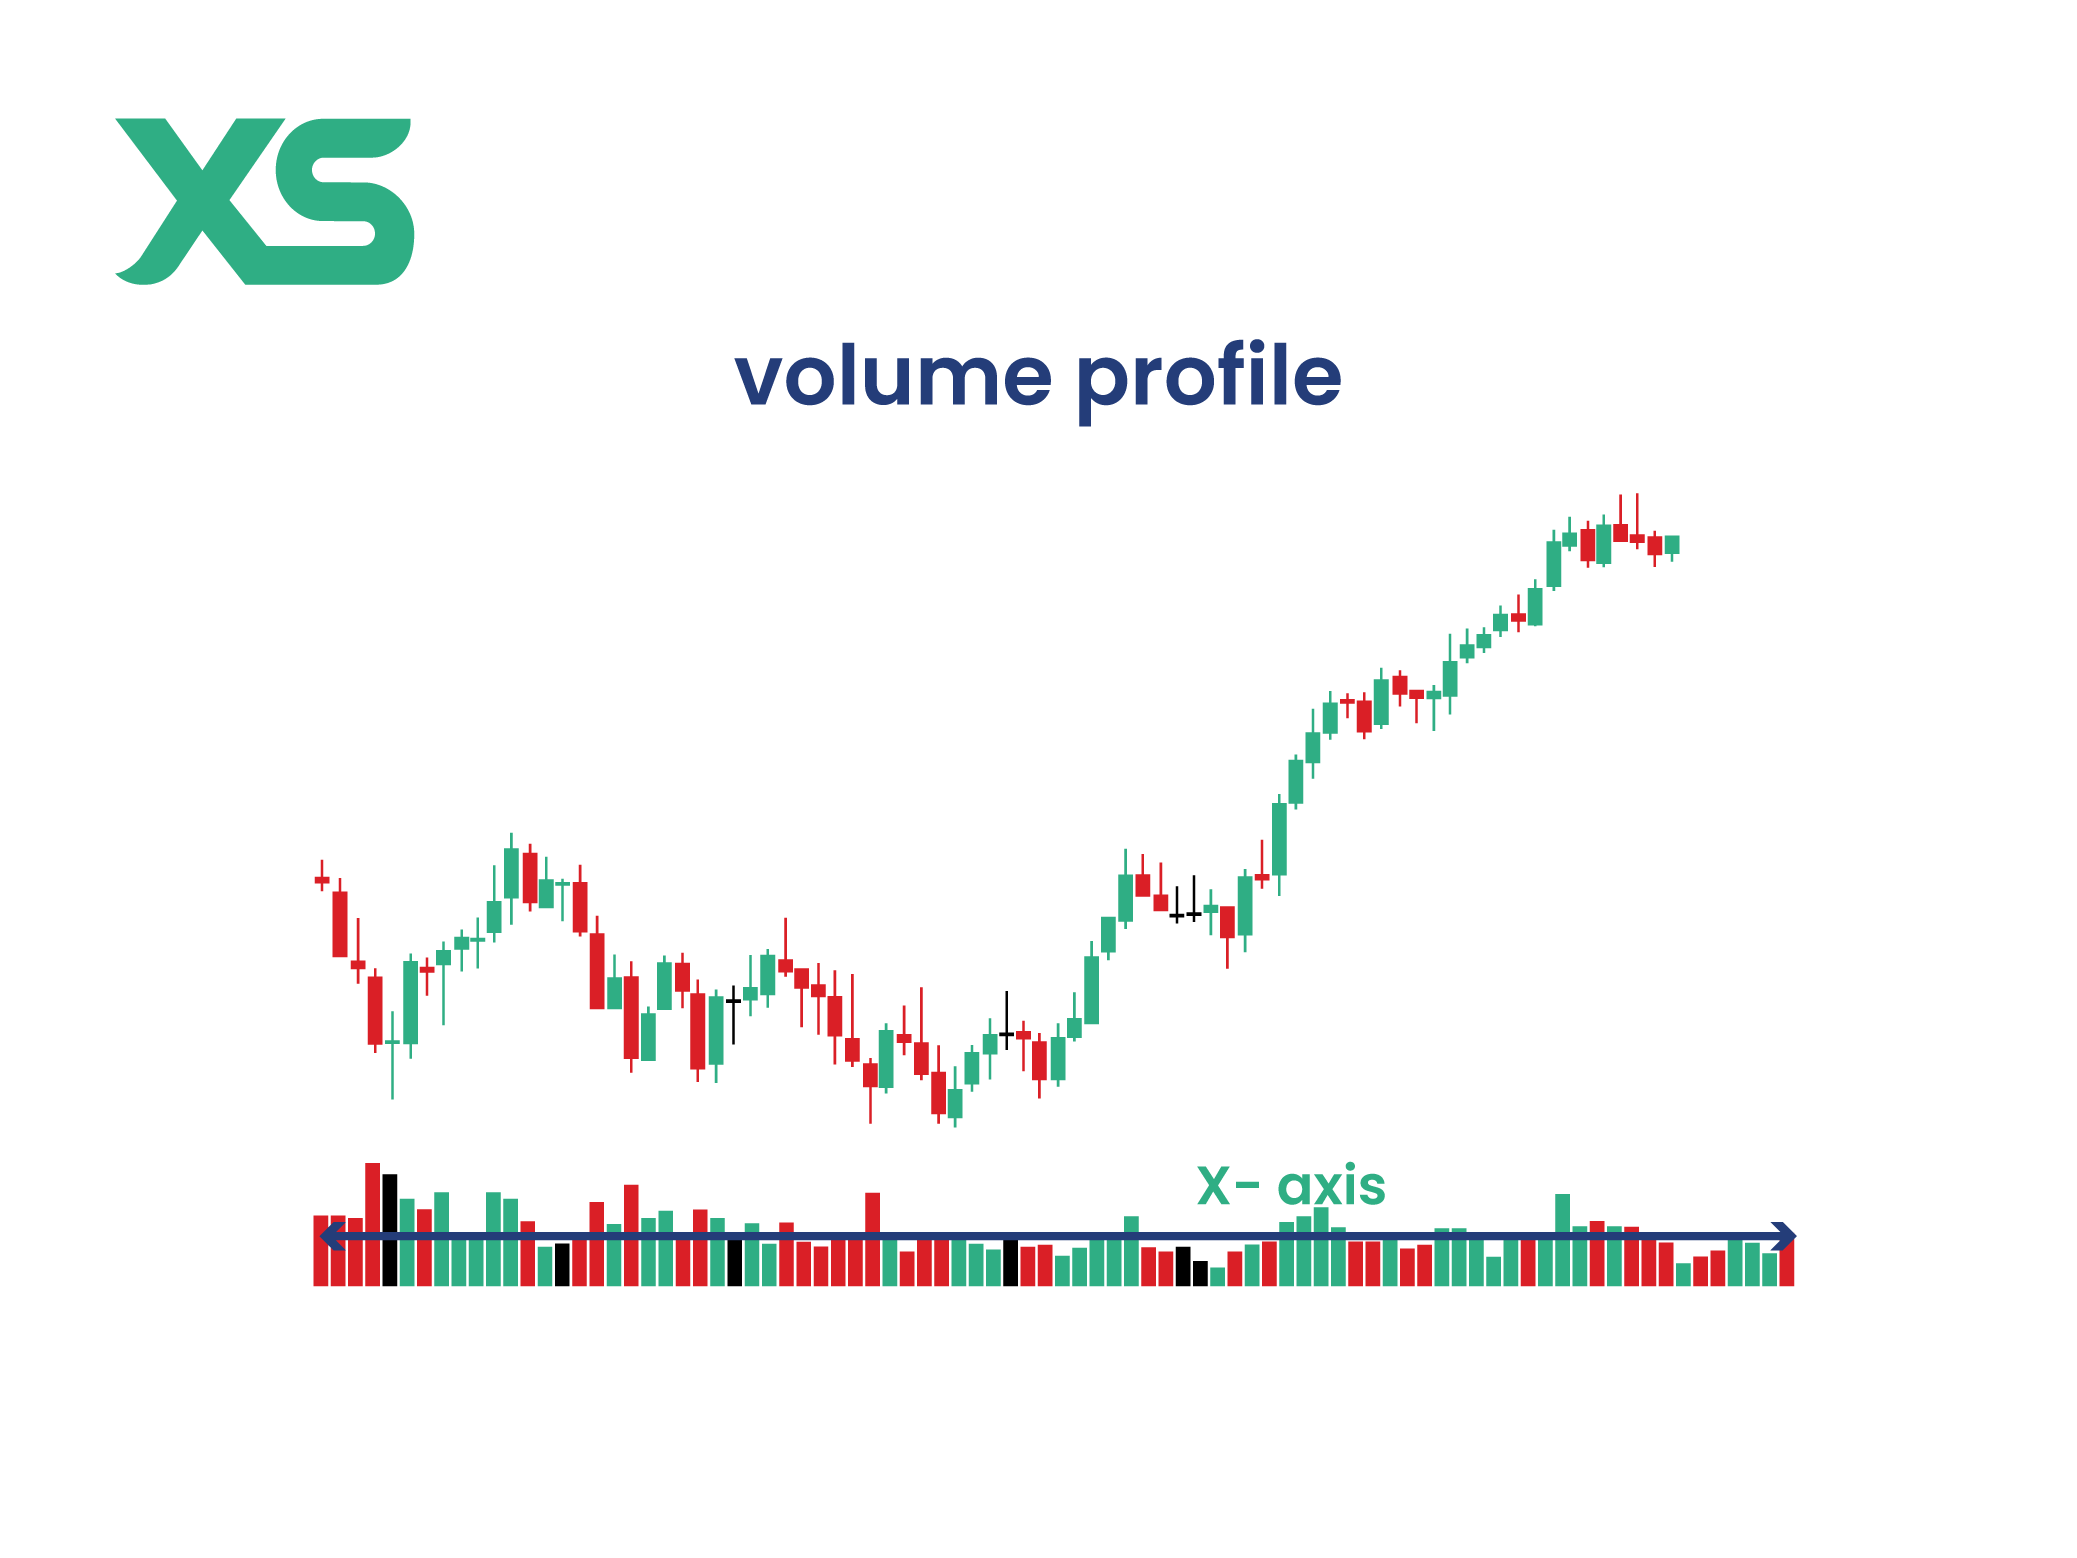
This horizontal representation allows traders to see at a glance where the highest and lowest volumes of trades occurred, providing insights into areas of strong support and resistance.
How to Analyze Volume Profile Indicator?
You can analyze the Volume Profile indicator to interpret market activity in several ways:
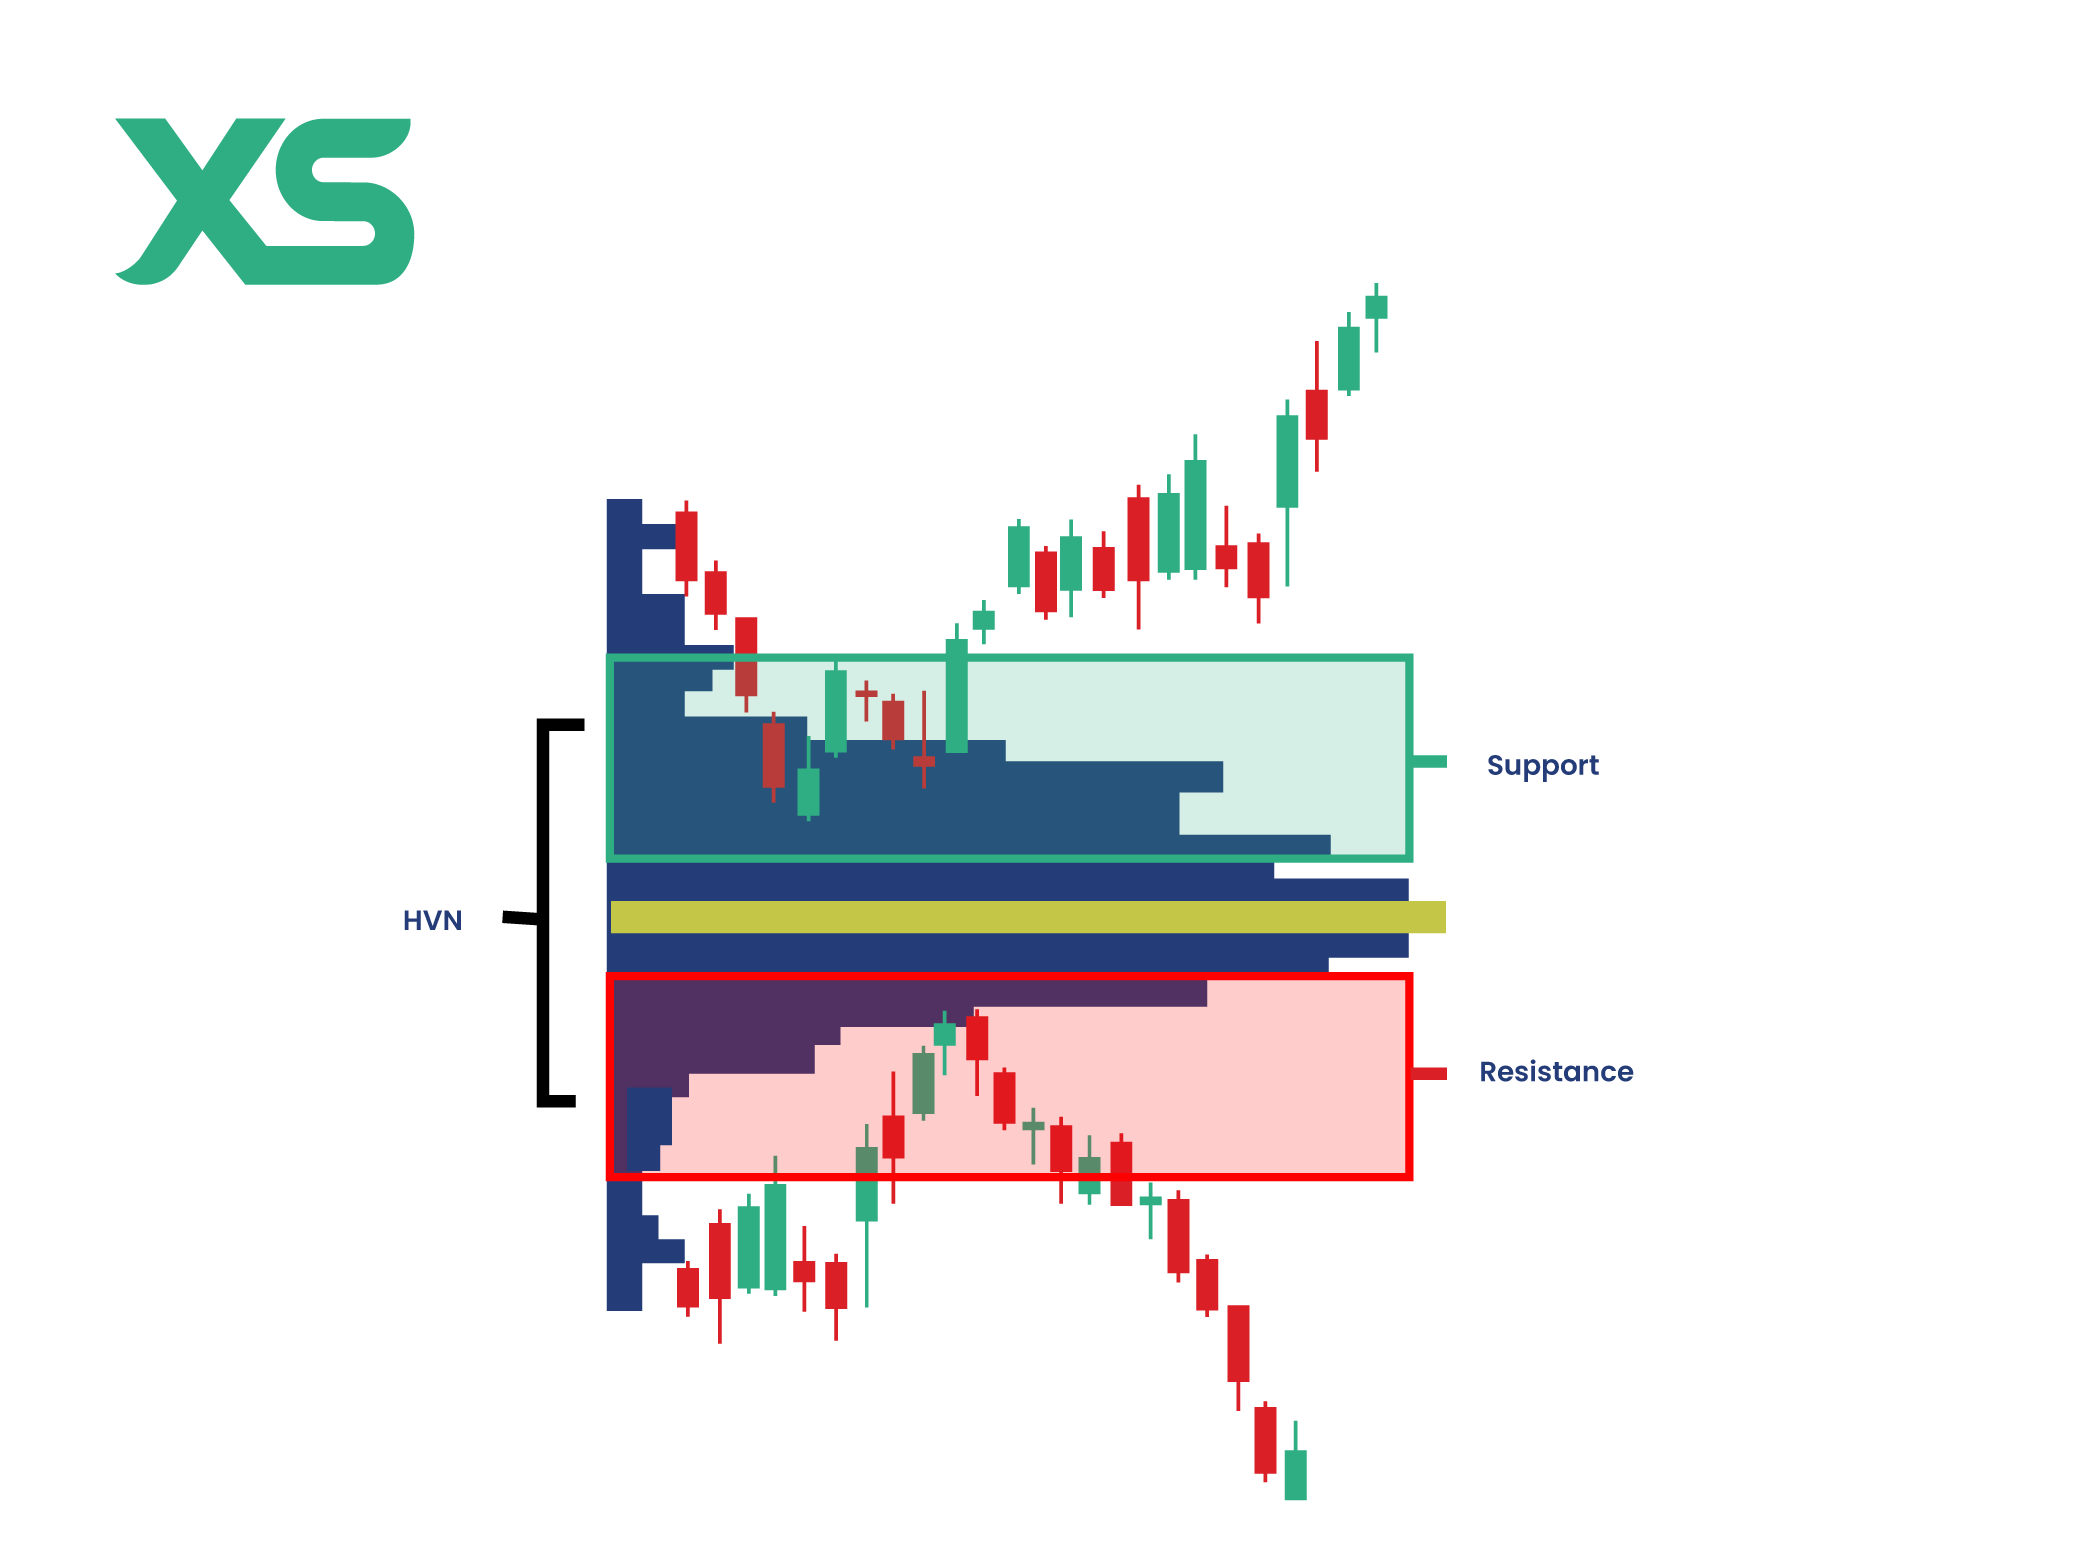
Identifying Support and Resistance
High-volume nodes (HVNs) on the Volume Profile chart typically indicate strong support or resistance levels.
These are price levels where significant trading has occurred, suggesting that traders are interested in these zones.
Conversely, Low-Volume Nodes (LVNs) indicate areas where trading activity is sparse, often leading to rapid price movement through these levels.
Analyzing Market Sentiment
The Point of Control (POC), which marks the price level with the highest traded volume, acts as a critical benchmark for traders.
Prices tend to gravitate towards this level due to the heavy trading activity.
Additionally, the Value Area (VA), representing the range where 70% of the volume was traded, helps traders understand the fair value range perceived by the market.
Predicting Price Movements
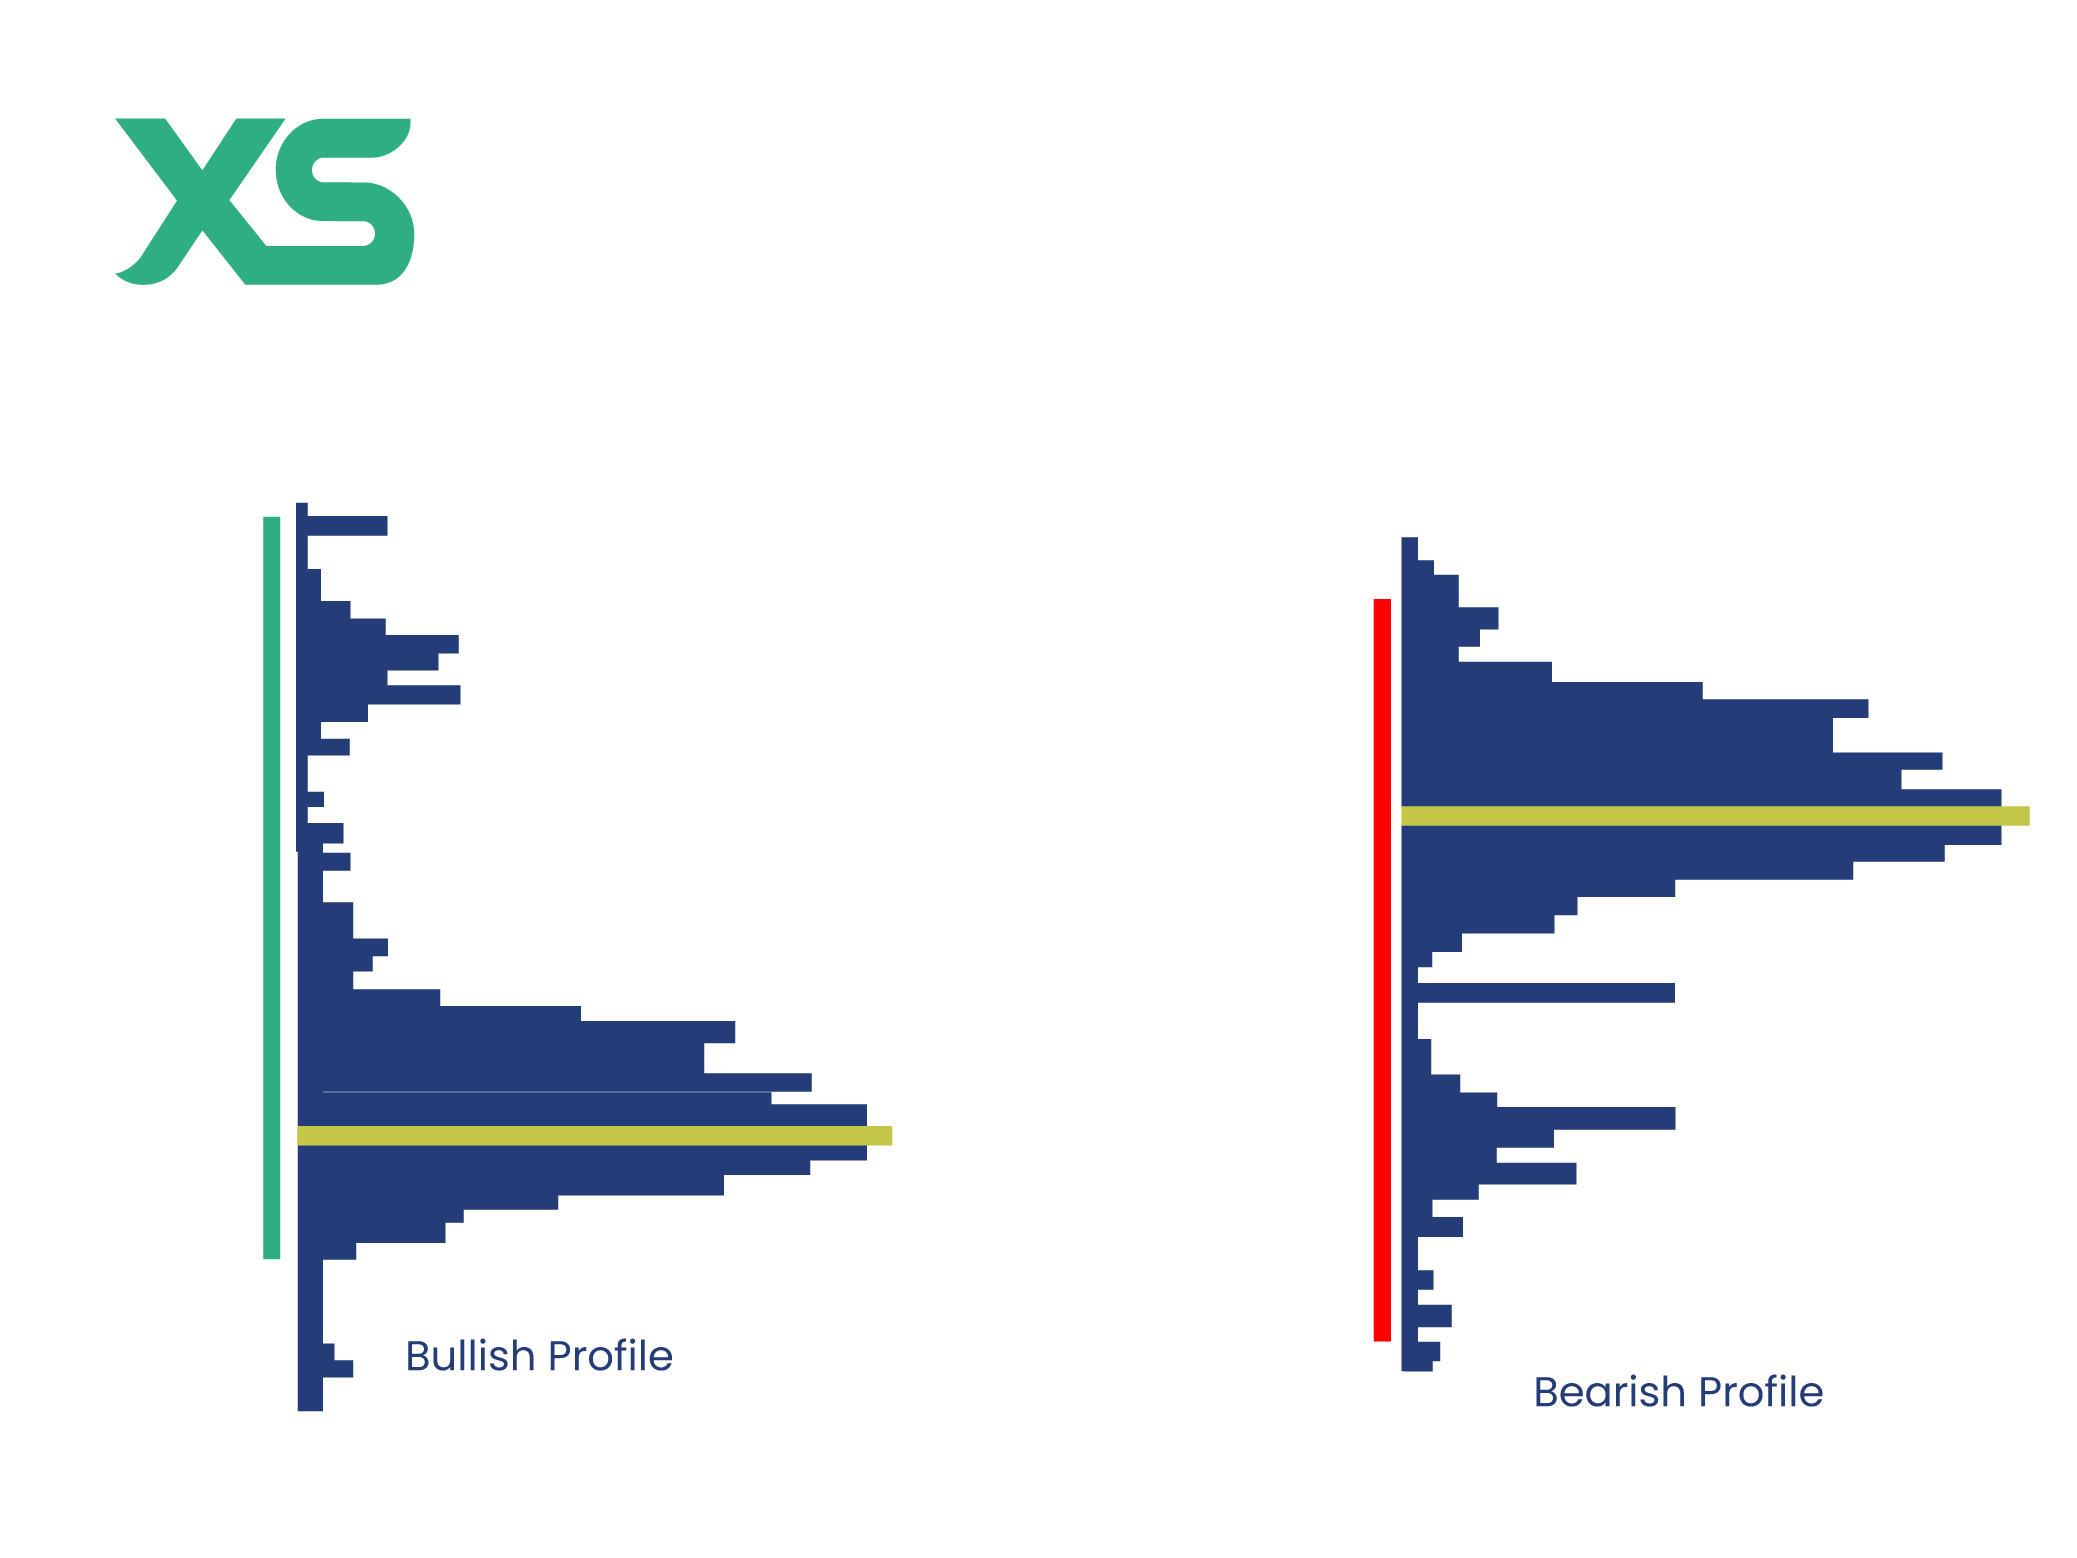
By examining the volume distribution across different price levels, traders can make informed predictions about future price movements.
For example, a volume concentration at higher price levels might indicate bullish sentiment, while a higher volume at lower price levels could suggest bearish sentiment.
Volume Profile Trading Strategies
Traders can use a couple of effective Volume Profile strategies to gain an edge in the market.
1. High-Volume Node Retracements
High-volume Node retracements in a Volume Profile trading strategy involve looking for price pullbacks in areas with high trading volume. These zones often act as strong support or resistance levels, providing good entry or exit points for trades.
2. Low-Volume Node Breakouts
Low-volume Node breakouts occur when the price moves through an area with low trading volume. These zones often see rapid price movement due to the lack of trading activity, offering potential opportunities for breakout trades.
3. Determine Trend with Distributions
By examining the distribution of volume across different price levels, traders can determine the market trend.
A bullish trend is often characterized by increasing volume at higher price levels, while a bearish trend shows increasing volume at lower prices.
4. Key Support & Resistance Levels
Volume Profile analysis helps identify key support and resistance levels based on trading activity. High Volume Nodes typically act as strong support or resistance, while Low Volume Nodes indicate potential breakout points.
How to Determine Volume Profile Time Frames
Determining the appropriate time frame for Volume Profile analysis is crucial for aligning the insights with your trading strategy and objectives.
The chosen time frame significantly influences how you interpret and apply volume data to your trades. Here’s how to approach selecting the right time frame for your needs:
Day Trading
For day traders who make multiple trades within a single trading session, shorter time frames such as 1-minute, 5-minute, or 15-minute charts are typically used.
These shorter time frames allow for more acute intraday price movements and volume distribution analysis.
By using the Volume Profile on these charts, day traders can identify key intraday support and resistance levels, spot potential breakout points, and make quick, informed decisions based on the immediate market context.
Swing Trading
Swing traders, who hold positions for several days to weeks, benefit from using daily or weekly Volume Profile charts.
These longer time frames provide a broader perspective on the market, highlighting significant volume clusters that can indicate strong support or resistance zones.
Analyzing volume distribution over these extended periods helps swing traders identify key price levels that are likely to influence price movements over the next few days or weeks, aiding in better trade planning and timing.
Position Trading
Position traders, who hold trades for weeks to months, often rely on even longer time frames, such as weekly or monthly charts.
Volume Profile analysis on these charts helps understand the long-term trends and major support and resistance levels.
This extended view allows position traders to make more strategic decisions, aligning their trades with the overall market direction and major volume nodes that indicate long-term investor interest.
Multi-Time Frame Analysis
Many traders employ a multi-timeframe analysis approach, combining Volume Profile data from different time frames to comprehensively understand the market.
For example, a trader might use a weekly Volume Profile to identify major support and resistance levels and then switch to a 4-hour or daily chart to fine-tune entry and exit points.
This method allows traders to align their short-term actions with long-term trends, enhancing the accuracy of their trades.
Conclusion
Incorporating Volume Profile into your trading strategy can provide a significant advantage by highlighting where the most trading activity occurs at different price levels.
By understanding and utilizing the key components of the Volume Profile indicator, you can better identify support and resistance levels, potential breakout points, and overall market sentiment. Join XS today and start using this indicator in your trades!
FAQs
What Is the 80% Rule in Volume Profile?
The 80% Rule in Volume Profile states that if the price enters the Value Area (where 70% of the previous session's volume occurred) from above or below and stays there for two consecutive 30-minute bars, there's an 80% chance it will traverse the entire Value Area.
Does Volume Profile Show Buys and Sells?
No, the Volume Profile does not differentiate between buys and sells. It shows the total volume traded at each price level, visually representing trading activity without specifying the direction of trades.
Which Volume Indicator is Best?
The best volume indicator depends on your trading strategy and preferences.
Volume Profile is excellent for visualizing volume distribution across price levels, while indicators like On-Balance-Volume (OBV) and the Volume Weighted Average Price (VWAP) are also popular for different analytical insights.
What Are the Downsides of Using Volume Profile?
The downside of using Volume Profile is its reliance on accurate volume data, which can be challenging in decentralized markets like forex.
It may also require additional context from other indicators and may not provide clear signals in all market conditions.


