Forex
Treynor Ratio Formula: Definition, Calculation, and Examples
By Sarah Abbas
22 July 2024

The Treynor Ratio is a financial metric that assesses the returns of an investment portfolio relative to its market risk.
This article will break down the Treynor Ratio, showing you how to compute it, apply it in real-world scenarios, and understand what the results mean for your investments.
Key Takeaways
-
The Treynor Ratio evaluates investment returns relative to market risk, indicating portfolio efficiency.
-
Unlike the Sharpe Ratio, which considers total risk, the Treynor Ratio focuses solely on systematic risk, making it ideal for assessing well-diversified portfolios.
-
The Treynor Ratio is not only a theoretical measure but also a practical tool for portfolio performance evaluation, investment comparison, and strategic risk management.
What Is the Treynor Ratio?
The Treynor Ratio is a performance metric used to evaluate the risk-adjusted returns of an investment portfolio.
Named after Jack Treynor, one of the pioneers of modern portfolio theory, the Treynor Ratio specifically measures the returns earned in excess of the risk-free rate per unit of market risk, as captured by the portfolio's beta.
This focus on systematic risk makes it a valuable tool for assessing well-diversified portfolios.
Difference Between the Treynor Ratio and Sharpe Ratio
While both the Treynor Ratio and Sharpe Ratio are used to measure risk-adjusted returns, there are key differences between them.
The Treynor Ratio focuses solely on systematic risk (beta), making it more suitable for diversified portfolios.
In contrast, the Sharpe Ratio considers total risk (standard deviation), including systematic and unsystematic risk.
The Treynor Ratio Formula
The Treynor Ratio is calculated using the following formula:
Treynor =Rp− Rf/βp

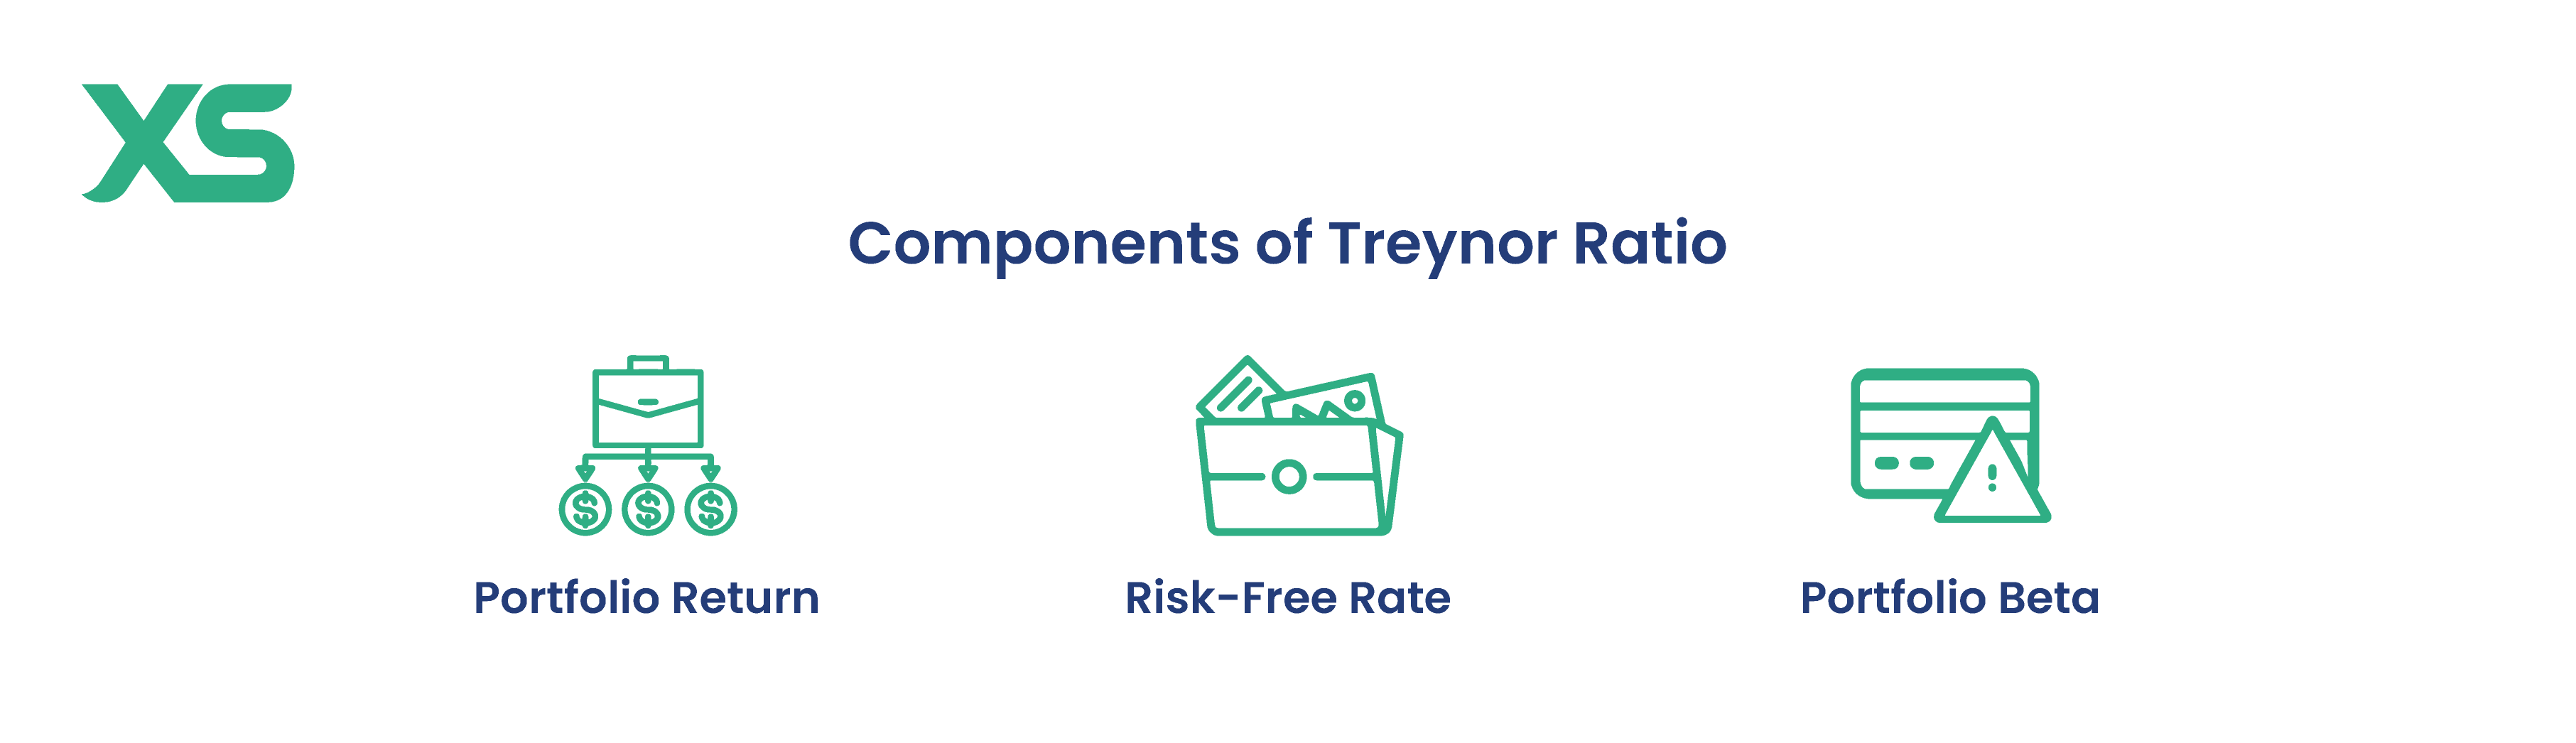
Where:
-
Rp =Portfolio return
-
Rf = Risk-free rate
-
βp = Portfolio beta
This formula essentially calculates the excess return earned per unit of market risk, providing a clear picture of how well the portfolio has performed relative to its market risk exposure.
How to Calculate Treynor Ratio
Calculating the Treynor Ratio involves a few simple steps:
-
Gather Data: Collect the portfolio return (Rp), risk-free rate (Rf), and portfolio beta (βp).
-
Subtract the Risk-Free Rate: Calculate the excess return by subtracting the risk-free rate from the portfolio return (Rp−Rf).
-
Divide by Beta: Divide the excess return by the portfolio beta (βp).
For example, if your portfolio return is 12%, the risk-free rate is 2%, and the portfolio beta is 1.5, the Treynor Ratio would be calculated as follows:
Treynor Ratio = 0.12 − 0.02/1.5 = 0.10/1.5 = 0.067.
Tools for Calculation
While you can calculate the Treynor Ratio manually, several tools can simplify the process:
-
Spreadsheet Software: Programs like Excel or Google Sheets can automate calculations using built-in functions.
-
Financial Calculators: These can quickly compute the Treynor Ratio given the necessary inputs.
-
Online Calculators: Numerous financial websites offer free Treynor Ratio calculators that only require data input.
Interpretation of the Formula
So, let’s see what the Treynor ratio tells us and how to use it effectively:
High Treynor Ratio
A high Treynor Ratio indicates that a portfolio is providing a good return relative to its risk. In other words, for every unit of market risk taken, the portfolio is delivering a higher level of return.
This is generally a positive sign and suggests that the portfolio is being managed efficiently, with returns that justify the level of risk involved.
For example, if you have two portfolios with Treynor Ratios of 0.1 and 0.2, the one with 0.2 delivers twice the return per unit of risk compared to the one with 0.1.
Low Treynor Ratio
Conversely, a low Treynor Ratio suggests that the portfolio's returns are not sufficient to compensate for the level of market risk it carries.
This could indicate that the portfolio is underperforming or that it is exposed to unnecessary risk without adequate returns.
For instance, a Treynor Ratio close to zero or negative means that the returns do not justify the risk, and the investment strategy might need reevaluation.
It's important to consider the context when interpreting the Treynor Ratio. Different market conditions, time periods, and investment strategies can affect the ratio.
For instance, during periods of high market volatility, a portfolio's beta may change, affecting the Treynor Ratio.
Example Scenario
Imagine you have two portfolios:
-
Portfolio A: Return of 12%, Risk-free rate of 2%, Beta of 1.2
-
Portfolio B: Return of 15%, Risk-free rate of 2%, Beta of 1.8
Calculating the Treynor Ratio for both:
Portfolio A: 0.12 - 0.02/1.2 =0.10/1.2 = 0.083
Portfolio B: 0.15 - 0.02/1.8= 0.13/1.8 = 0.072
So, despite Portfolio B's higher return, Portfolio A has a higher Treynor Ratio, indicating better risk-adjusted performance.
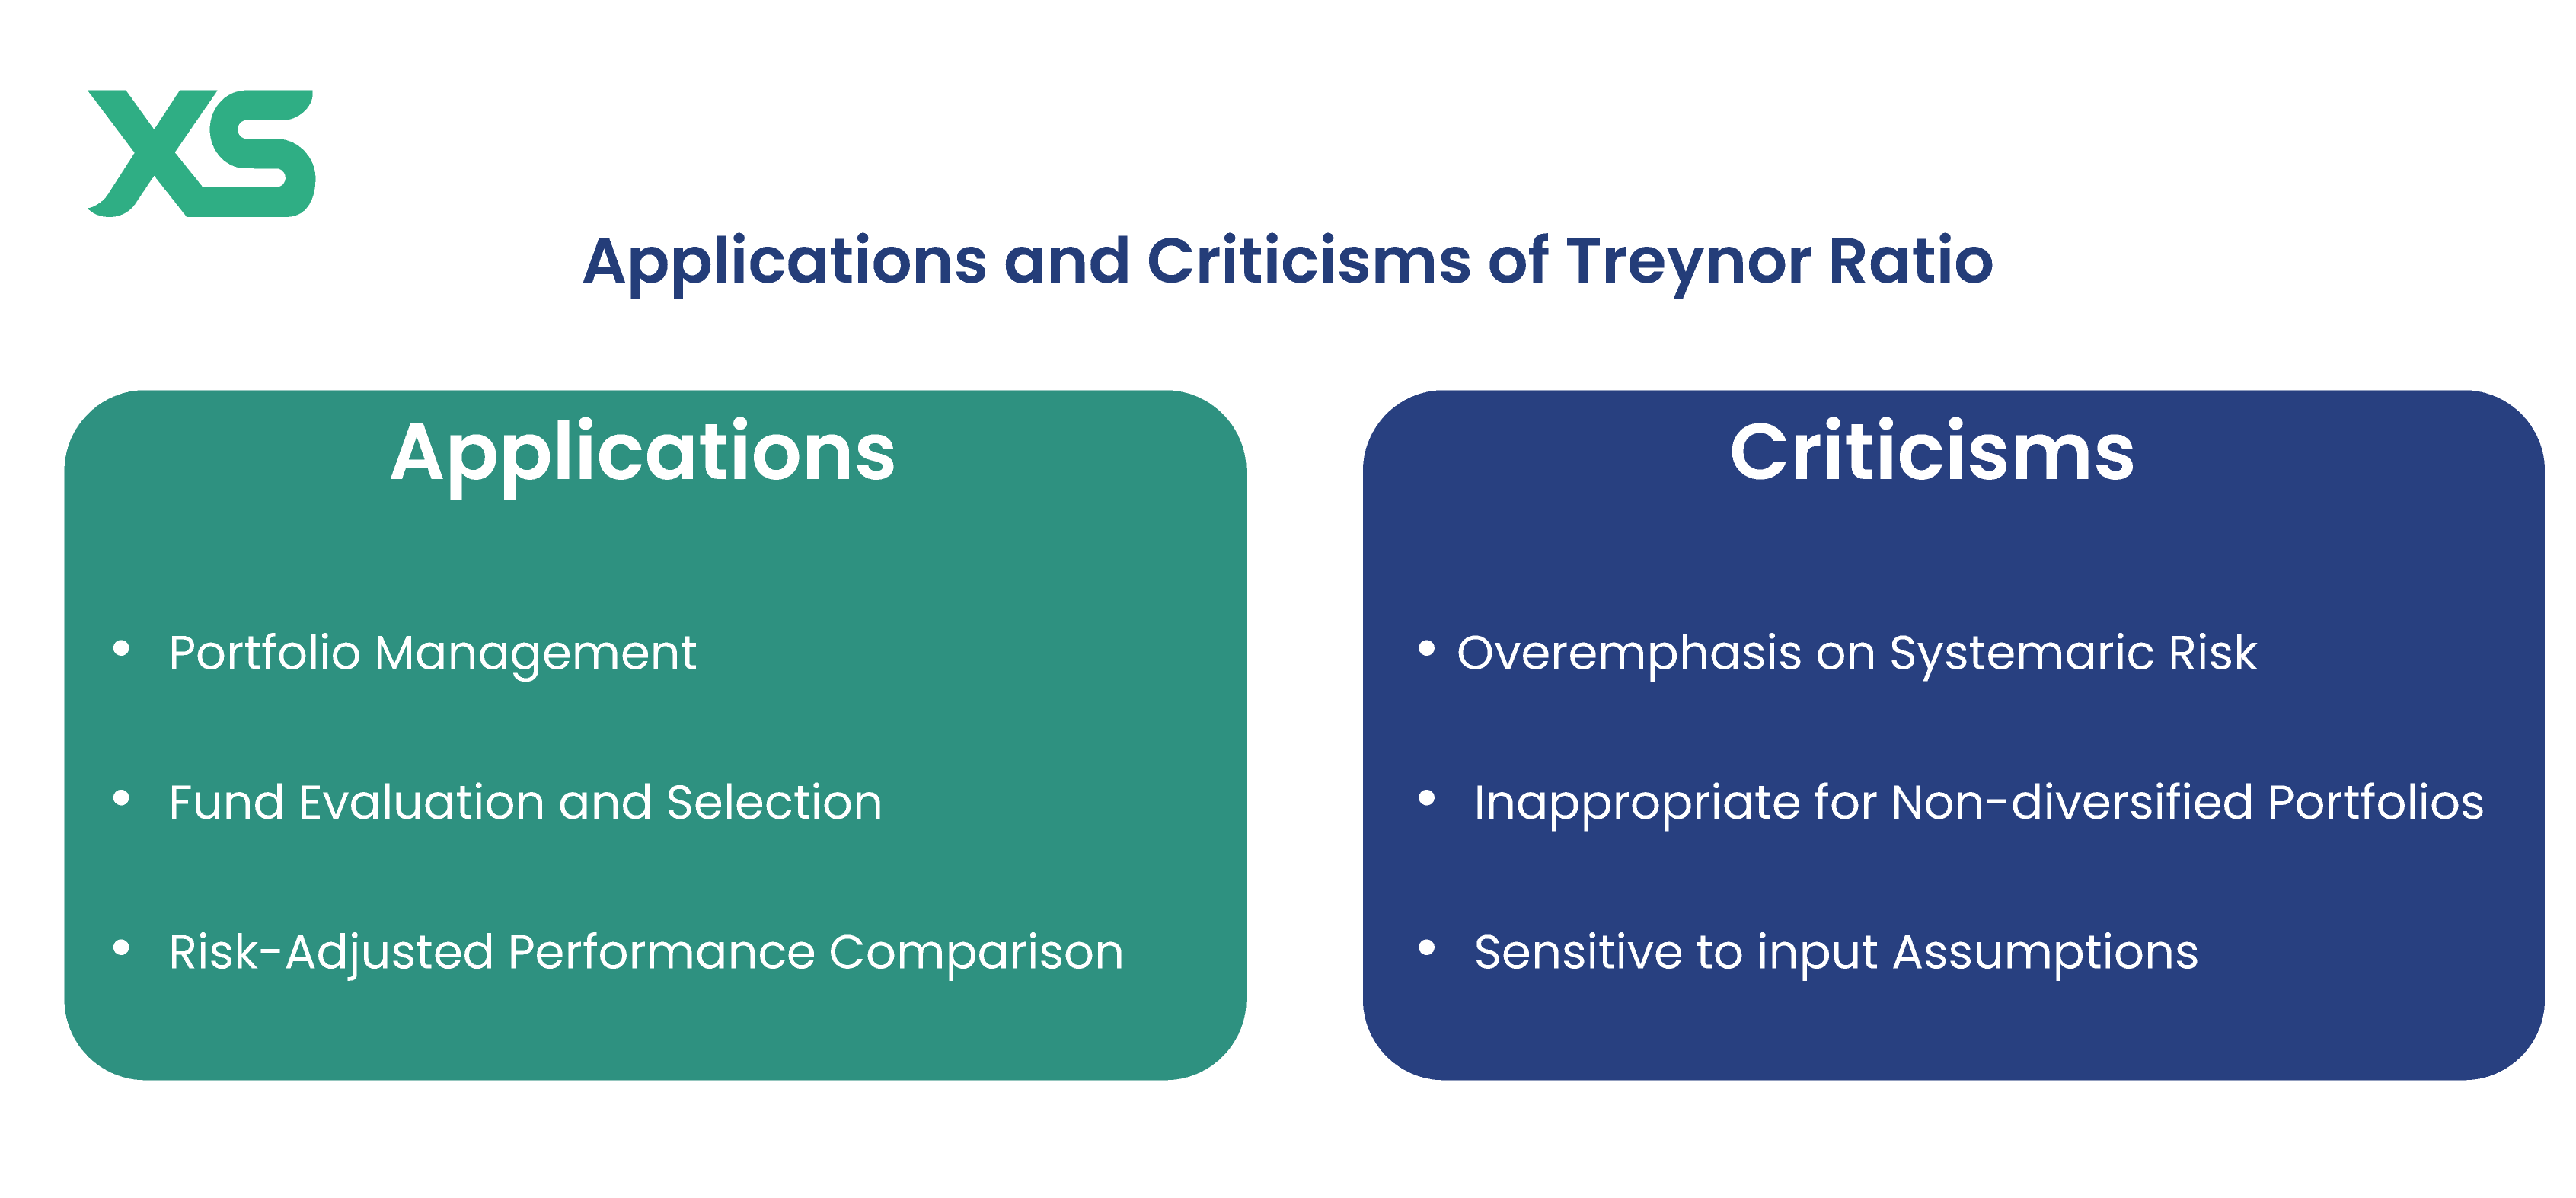
Applications of the Treynor Ratio
The Treynor Ratio has several practical applications in investment analysis:
-
Portfolio Performance Evaluation: It helps investors assess how well their portfolio performs relative to its market risk.
-
Investment Comparison: Investors can use the Treynor Ratio to compare the performance of different portfolios or funds.
-
Risk Management: By focusing on systematic risk, the Treynor Ratio helps identify whether a portfolio's returns are justified given its exposure to market movements.
Strategic Portfolio Adjustments
Given the insights derived from the Treynor Ratio, investors can strategically adjust their portfolios to enhance their risk-adjusted returns.
If a portfolio consistently shows a low Treynor Ratio, it might be a signal to either increase the expected return without raising the beta significantly or to lower the beta of the portfolio, possibly by diversifying or choosing less volatile investments.
Monitoring Over Time
The Treynor Ratio is not just a one-time calculation but a metric that should be monitored over time to track an investment's performance relative to market changes.
Regular assessment can help investors recognize trends, such as a decreasing Treynor Ratio, which might indicate increasing risk or diminishing returns.
When to Rely on the Treynor Ratio
You should consider using the Treynor Ratio primarily when evaluating portfolios that are exposed to market fluctuations and where diversification has minimized unsystematic risk.
It's particularly useful for comparing the performance of different mutual funds or managed portfolios where the focus is on how well managers compensate for market-related risks.
How to Combine Treynor Ratio with Other Metrics
For a comprehensive portfolio analysis, it's advisable to combine the Treynor Ratio with other performance metrics like the Sharpe Ratio or Alpha. Each of these metrics provides different insights:
-
The Sharpe Ratio assesses how well an investment performs in relation to both systematic and unsystematic risk.
-
Alpha indicates the ability of a portfolio to outperform a benchmark index based on identical risk levels.
Using multiple metrics can provide a more nuanced view of an investment's performance and risks, allowing you to make more balanced and informed decisions.
Advantages and Limitations of the Treynor Ratio
While the Treynor Ratio is invaluable for assessing risk-adjusted returns, it's crucial to acknowledge its limitations.
Treynor Ratio Advantages
-
Focus on Systematic Risk: The Treynor Ratio specifically measures returns against market risk, making it ideal for evaluating diversified portfolios.
-
Simplicity and Clarity: The formula is straightforward and easy to interpret, providing clear insights into risk-adjusted performance.
Treynor Ratio Limitations
-
Dependence on Beta: The accuracy of the Treynor Ratio depends on the reliability of beta as a measure of risk, which can sometimes be unstable.
-
Applicability: It is most useful for well-diversified portfolios and may not be as effective for evaluating individual securities or non-diversified portfolios.
Conclusion
The Treynor Ratio is a valuable tool for investors looking to understand and optimize their risk-adjusted returns.
By focusing on systematic risk, it provides clear insights into whether a portfolio is delivering adequate returns for the level of market risk it carries.
Understanding how to calculate and interpret the Treynor Ratio, along with its advantages and limitations, can help you make more informed decisions. Join XS to start applying the Treynor Ratio today!
FAQs
Is a Higher or Lower Treynor Ratio Better?
A higher Treynor Ratio is definitely better. It means you’re getting more return per unit of market risk, which indicates efficient investment management.
What Does a Treynor Ratio of 0.5 Mean?
A Treynor Ratio of 0.5 indicates that for every unit of market risk, your portfolio is earning half a unit of excess return over the risk-free rate. It's quite a solid performance, especially if the market is volatile.
How Do Treynor and Alpha Differ from Sharpe?
Treynor and Alpha focus on different aspects of performance: Treynor measures returns against market risk (beta), while Alpha measures returns above a benchmark, assuming the same risk.
The Sharpe Ratio, on the other hand, considers total risk (including unsystematic risk) in the denominator, giving a broader measure of risk-adjusted performance.


