Forex
Quasimodo Pattern: How To Spot And Trade It
Written by Nathalie Okde
Fact checked by Rania Gule
Updated 2 April 2025

Table of Contents
The Quasimodo pattern is a technical pattern that helps you identify high-probability trade setups by leveraging support and resistance zones and false breakout patterns.
In this article, we'll explore everything you need to know about the Quasimodo pattern, how to trade it, and how to minimize risks when applying it in forex, stocks, or crypto markets.
Key Takeaways
-
The Quasimodo pattern is a price action setup that helps you identify market reversals with strong support and resistance levels.
-
It consists of a trend structure shift, forming a false breakout before reversing sharply.
-
You can confirm the pattern using indicators like Fibonacci retracements, RSI divergence, and moving averages.
-
Proper risk management, including stop-loss placement and confluence with other strategies, enhances the pattern’s effectiveness.
Try a No-Risk Demo Account
Register for a free demo and refine your trading strategies.
Open Your Free Account
What Is Quasimodo Pattern?
The Quasimodo pattern (QM pattern) is a highly effective price action pattern that helps you identify potential market reversal patterns and continuation setups.
It is widely used in forex trading, crypto trading, and stock markets due to its reliability in pinpointing strong support and resistance zones.
When Does the Pattern Form?
This pattern forms when price makes a series of higher highs and higher lows in an uptrend (or lower highs and lower lows in a downtrend) before reversing sharply.
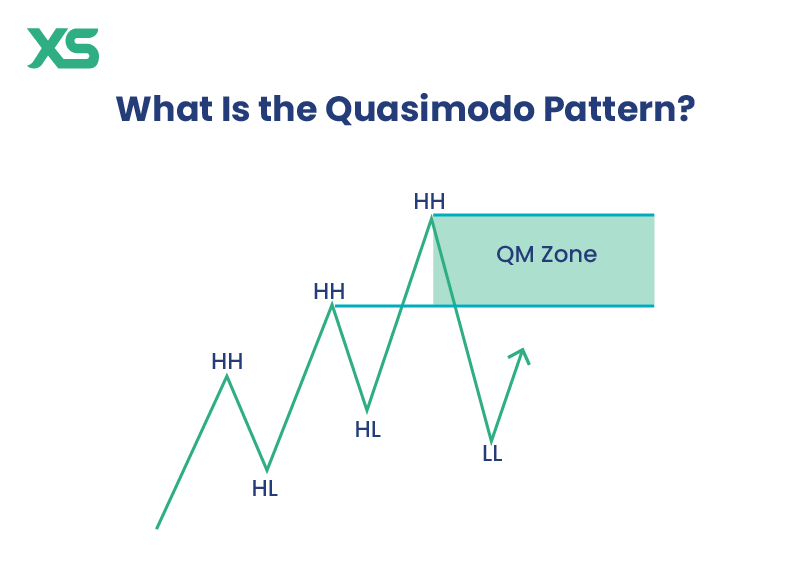
It consists of five key points:
-
A strong trend (bullish or bearish).
-
A higher high (HH) or lower low (LL).
-
A retracement to form a higher low (HL) or lower high (LH).
-
A break of market structure (BOS), where price creates a new lower low (in an uptrend) or a new higher high (in a downtrend).
-
A retracement back to a key level, offering an entry opportunity.
The Quasimodo pattern is also known as the Over and Under pattern, as it tricks traders into believing a trend will continue before reversing sharply.
How to Spot a Quasimodo Pattern on a Price Chart
To identify the Quasimodo pattern, look for:
-
A clear trend before the pattern formation.
-
A high or low break, followed by a retracement.
-
A higher high/lower low, showing a shift in structure.
-
A rejection of key support/resistance zones.
Quasimodo Pattern Types
There are different types of the quasimodo pattern: bullish, bearish, reversal, and continuation.
Bullish Quasimodo Pattern
The bullish Quasimodo pattern appears at the end of a downtrend, signaling a potential reversal to the upside.
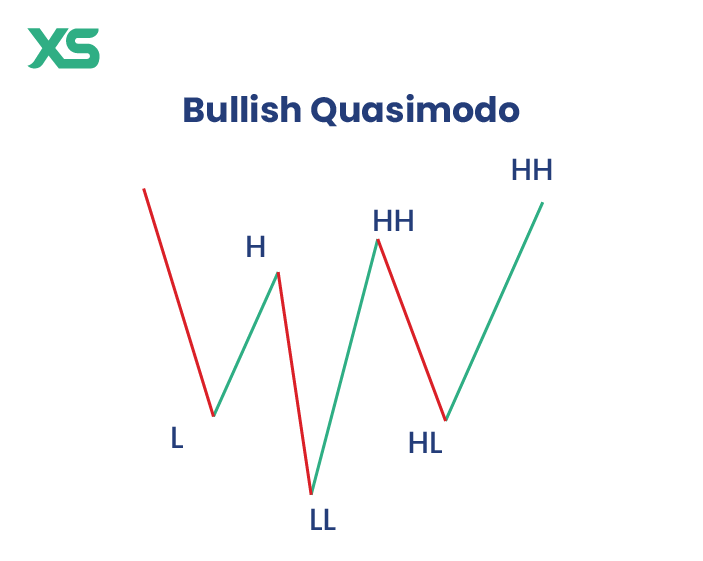
Here’s how it forms:
-
The market makes lower lows (LL) and lower highs (LH).
-
A new lower low is formed, keeping traders convinced the downtrend will continue.
-
Suddenly, price breaks structure by forming a new higher high (HH).
-
Price then retraces to a strong support zone, typically near the previous lower low.
-
A bullish reversal occurs, confirming the trade.
Bearish Quasimodo Pattern
The bearish Quasimodo pattern is the opposite of the bullish version and occurs at the end of an uptrend, signaling a market reversal to the downside.
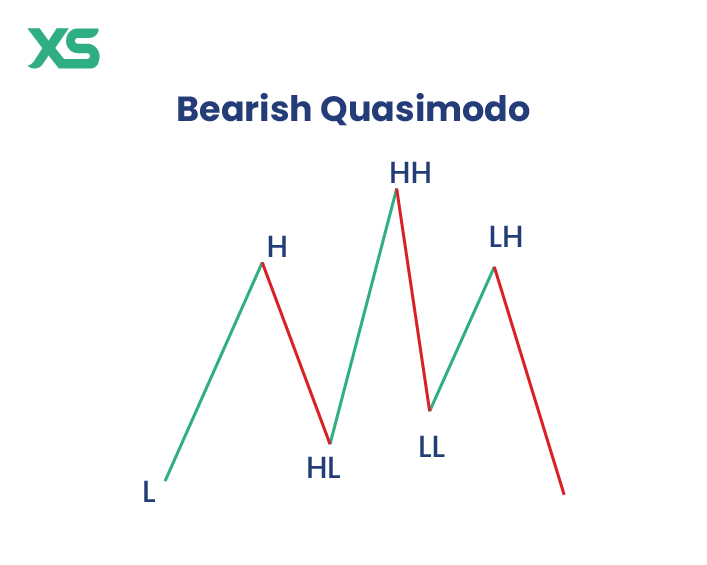
The steps are:
-
Price is making higher highs (HH) and higher lows (HL).
-
A new higher high is formed, trapping breakout traders.
-
Suddenly, price breaks structure, forming a new lower low (LL).
-
Price retraces back to the previous higher high level, acting as resistance.
-
A strong bearish move confirms the pattern.
Quasimodo Reversal Pattern
The Quasimodo reversal pattern is the primary application of this formation.
It signals when an existing trend is likely to reverse direction, giving you a strong indication of a shift in market sentiment.
The best markets for the quasimodo reversal pattern:
-
Forex (major currency pairs like EUR/USD, GBP/USD)
-
Stocks (particularly in trending equities)
-
Crypto (Bitcoin and altcoins during trend exhaustion)
Quasimodo Continuation Pattern
While primarily a reversal pattern, the Quasimodo structure can also indicate a trend continuation when price briefly retraces before continuing in the same direction.
How to identify a continuation quasimodo:
-
Occurs within a strong trend
-
Instead of reversing, price respects key levels and continues the trend
-
Used in trend-following strategies
What Is the Difference Between Quasimodo and Head and Shoulders?
At first glance, the Quasimodo pattern and the head and shoulders pattern may seem similar, but there are key differences between them.
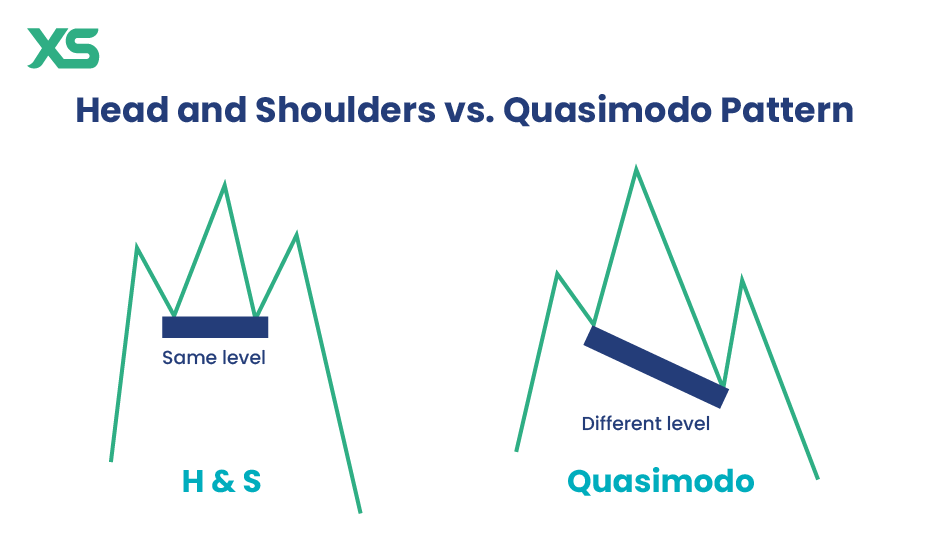
The Head and Shoulders pattern is a classic reversal formation consisting of three peaks: a higher peak (head) between two lower peaks (shoulders).
This pattern signals a trend reversal when the price breaks below the neckline.
On the other hand, the Quasimodo pattern is based on the concept of higher highs and lower lows (in an uptrend) or lower lows and higher highs (in a downtrend).
It forms when price creates a significant higher high or lower low, followed by a sharp reversal breaking the prior trend’s structure.
Unlike the Head and Shoulders pattern, Quasimodo does not require a symmetrical structure, making it more adaptable to different market conditions.
How to Confirm the Pattern with Technical Indicators?
While price action alone can be a strong confirmation for trading the Quasimodo pattern, using technical indicators can increase accuracy and confidence in executing trades.
Here are some key indicators to watch:
Fibonacci Retracement
The retracement level often aligns with key Fibonacci zones (61.8% or 78.6%), reinforcing the validity of the pattern.
RSI (Relative Strength Index)
If the RSI shows divergence, where price makes a higher high but RSI forms a lower high (for a bearish QM), this strengthens the reversal signal.
Moving Averages
The 50 EMA and 200 EMA can help confirm the trend. A QM setup that aligns with a moving average crossover adds confluence to the trade.
Volume Analysis
A spike in volume at key support/resistance levels can signal stronger market participation and increase the probability of a successful trade.
How to Trade the Quasimodo Pattern
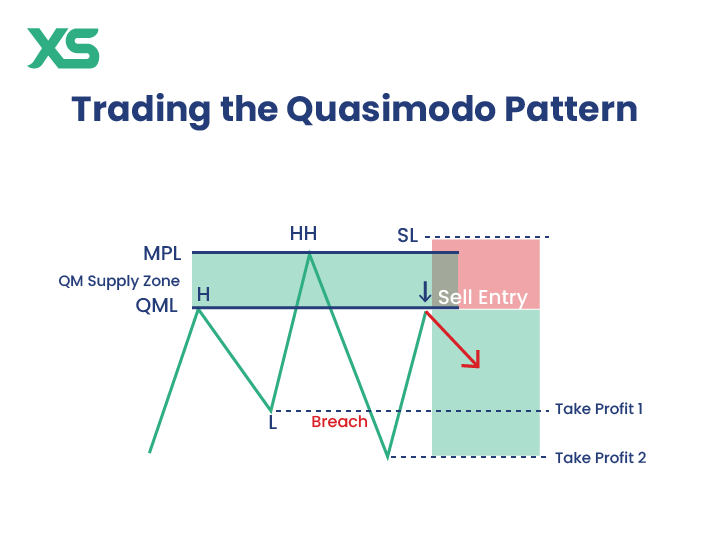
To effectively trade the Quasimodo pattern, you should identify the pattern, confirm it, and then apply the right risk management strategies.
Quasimodo Pattern Exit Points
Knowing when to exit a trade is just as important as knowing when to enter.
Exit points for the Quasimodo pattern can be determined using:
-
Previous Support or Resistance Levels: The most common exit strategy involves setting the target at the nearest significant support or resistance level.
-
Fibonacci Extensions: Traders often use the 127.2% or 161.8% Fibonacci extension levels to estimate potential profit targets.
-
Trailing Stop Strategy: A dynamic exit approach involves trailing stop-loss orders to lock in profits as the price moves in favor of the trade.
Quasimodo Pattern Entry Points
The ideal entry point for a Quasimodo pattern occurs at the level where the market structure shifts.
You can enter trades in the following ways:
-
Aggressive Entry: Placing a limit order at the QM level and entering as soon as the price reaches it. This method requires a tight stop loss.
-
Conservative Entry: Waiting for confirmation, such as a rejection candle, before entering the trade. This approach minimizes the risk of false breakouts.
-
Breakout Entry: Entering after the price breaks the neckline of the pattern and retests the QM level, confirming the new trend direction.
Quasimodo Pattern Stop Loss Placement
Placing a stop loss correctly is essential to prevent excessive losses. The best stop loss placement strategies for the Quasimodo pattern include:
-
Above/Below the QM Level: A common approach is placing the stop loss slightly beyond the Quasimodo level to avoid being stopped out by minor fluctuations.
-
ATR-Based Stop Loss: Using the Average True Range (ATR) to determine a dynamic stop loss based on market volatility.
-
Structural Stop Loss: Placing the stop loss at the most recent swing high (for short trades) or swing low (for long trades), ensuring it aligns with the overall market structure.
Pros and Cons of the Quasimodo Pattern
The quasimodo pattern has its own set of pros and cons.
Pros
One of the key advantages of the Quasimodo pattern is its high accuracy. When properly identified, this pattern provides reliable reversal signals, making it a valuable tool for traders looking for strong market entries.
Another major benefit is that the Quasimodo pattern offers clear entry and exit points. The structured nature of this pattern allows traders to define precise levels for entering trades, setting stop losses, and taking profits, reducing uncertainty in trade execution.
The versatility of the Quasimodo pattern is also a strong advantage, as it works across multiple markets.
Cons
Despite its benefits, the Quasimodo pattern has some drawbacks. One major challenge is that it requires experience.
Identifying the pattern accurately and distinguishing valid setups from false ones takes time and practice, making it less suitable for beginner traders.
Another downside is the possibility of false signals. Market noise and minor fluctuations can sometimes create misleading patterns, leading traders to take positions that do not yield the expected results.
To improve accuracy, the Quasimodo pattern needs confluence for higher probability. Traders often combine it with other technical indicators, such as RSI, moving averages, or Fibonacci levels, to confirm its validity.
Conclusion
The Quasimodo pattern is a highly effective trading setup that provides clear entry and exit points by leveraging market structure shifts. Whether trading forex, stocks, or crypto, understanding and applying this pattern can enhance trade accuracy and risk management.

Get the latest insights & exclusive offers delivered straight to your inbox.
Table of Contents
FAQs
It is a price action reversal pattern that signals the end of a trend and the beginning of a new one.
It is highly reliable when combined with support/resistance levels and technical indicators.
Common mistakes in trading the quasimodo pattern include misidentifying the pattern, entering trades without confirmation, and poor risk management.
By spotting the pattern on lower timeframes (M15, M30) and combining it with support and resistance.
It works the same way as in forex or stocks, helping traders catch reversals in Bitcoin, Ethereum, and other cryptocurrencies.
This written/visual material is comprised of personal opinions and ideas and may not reflect those of the Company. The content should not be construed as containing any type of investment advice and/or a solicitation for any transactions. It does not imply an obligation to purchase investment services, nor does it guarantee or predict future performance. XS, its affiliates, agents, directors, officers or employees do not guarantee the accuracy, validity, timeliness or completeness of any information or data made available and assume no liability for any loss arising from any investment based on the same. Our platform may not offer all the products or services mentioned.


