Forex
ICT Trading: What Is Inner Circle Trading?
Written by Nathalie Okde
Fact checked by Samer Hasn
Updated 30 January 2025

Table of Contents
ICT trading, short for Inner Circle Trader, is a strategy developed by Michael J. Huddleston that focuses on understanding the market from the perspective of institutional traders.
This article explains the details of this trading strategy, exploring its core concepts, trading methods, benefits, and drawbacks.
Key Takeaways
-
ICT trading was developed by Michael J. Huddleston and focuses on institutional trading strategies.
-
The strategy uses the Inter-Bank Price Delivery algorithm to identify market manipulation and key zones.
-
Swing points and liquidity zones are essential for recognizing market trends in ICT trading.
Try a No-Risk Demo Account
Register for a free demo and refine your trading strategies.
Open Your Free Account
What Is ICT Trading?
ICT trading, short for Inner Circle Trader, is a trading strategy created by Michael J. Huddleston.
This method focuses on understanding the market through the eyes of institutional traders, also known as "smart money."
It is based on the Inter Bank Price Delivery algorithm, which identifies patterns of market manipulation, pinpoints key zones like order blocks and fair value gaps, and anticipates the actions of large financial institutions.
Who Is Michael J. Huddleston?
Michael J. Huddleston is a leading figure in trading education, known for his unique approach to understanding and mastering the markets.
He aims to make these advanced trading techniques, known as ICT trading, accessible to beginners and experienced traders. He’s built a reputation for offering insights into methods like "Bank Trading," "Interbank Trading," and price action trading.
Additionally, he claims that his concepts are based on his own research and that no other mentor or system matches the depth of his strategies.
Huddleston currently has 1.43 million subscribers on his YouTube channel, where his most popular videos are ICT mentorship content.
He also has multiple playlists, such as ICT chart content and ICT trade executions, where he breaks down complex concepts into manageable, easy-to-understand lessons.
Moreover, he posts further in-depth content on the Inner Circle Trading website, such as trading courses and tutorials.
9 ICT Trading Concepts You Should Know
ICT trading is built on several core concepts that provide a deep understanding of market dynamics.
Let’s break these down with detailed explanations and examples:
ICT Trading: Swing Points
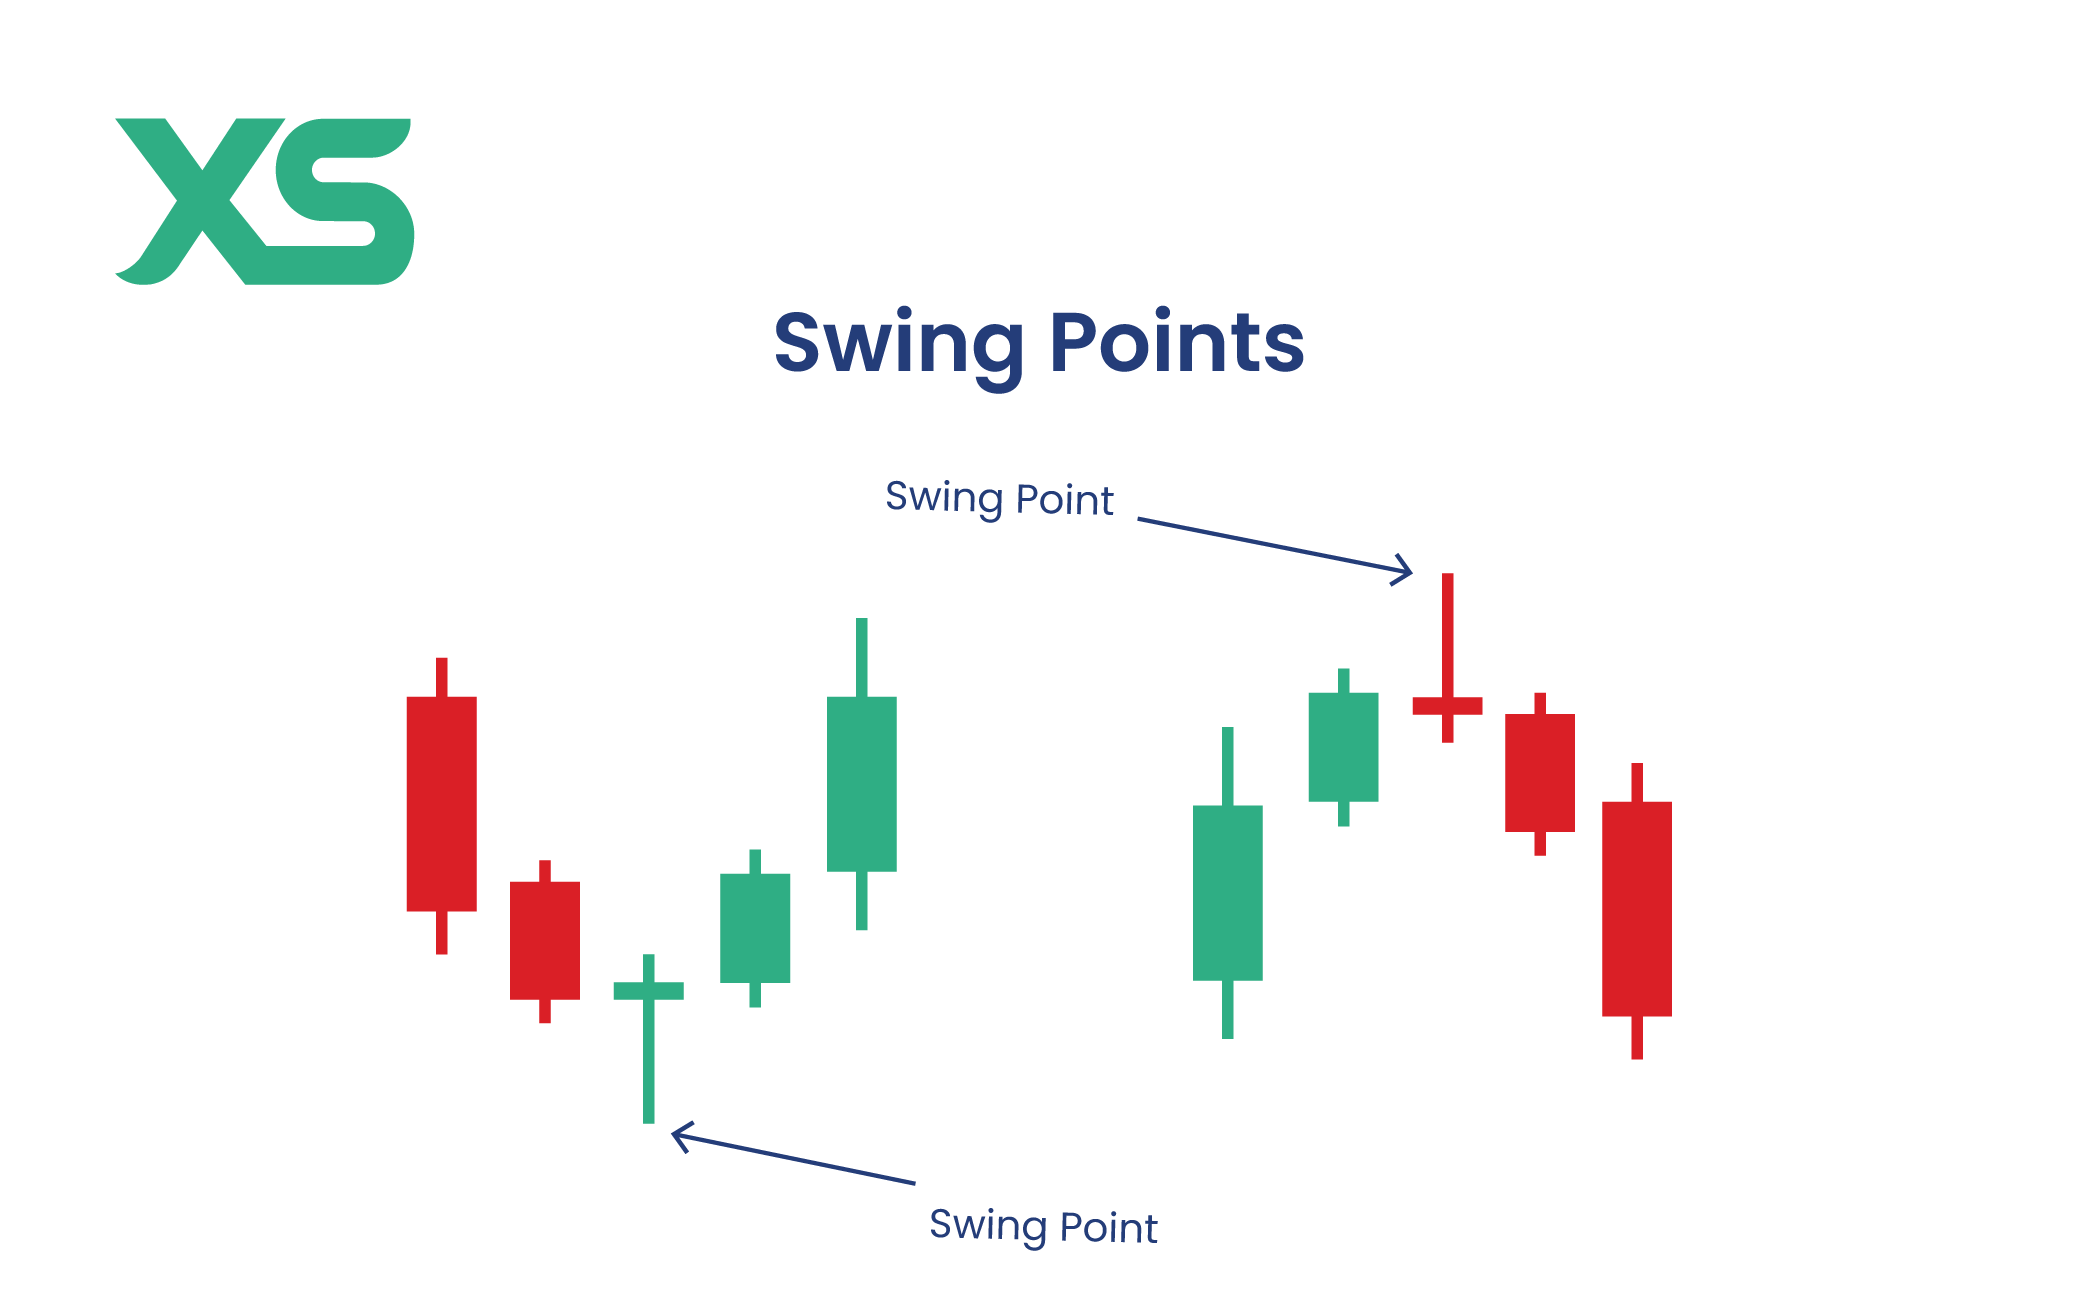
Swing points are a price chart's high and low points, indicating potential reversal areas.
-
For example, if a stock price has been rising and then reaches a peak before starting to fall, that peak is a swing high.
-
Conversely, if the price has fallen and then hits a low before rising again, that low is a swing low.
Identifying these points helps you recognize market trends and potential entry or exit points.
For example, if you notice the EUR/USD rising to a peak of 1.2000 before falling, you identify this as a swing high, signaling a potential reversal point.
If the price then drops to 1.1900 and starts to rise again, you identify this as a swing low and consider entering a buy trade at this point, anticipating the price will continue to move upward from the swing low.
ICT Trading: Liquidity Zones
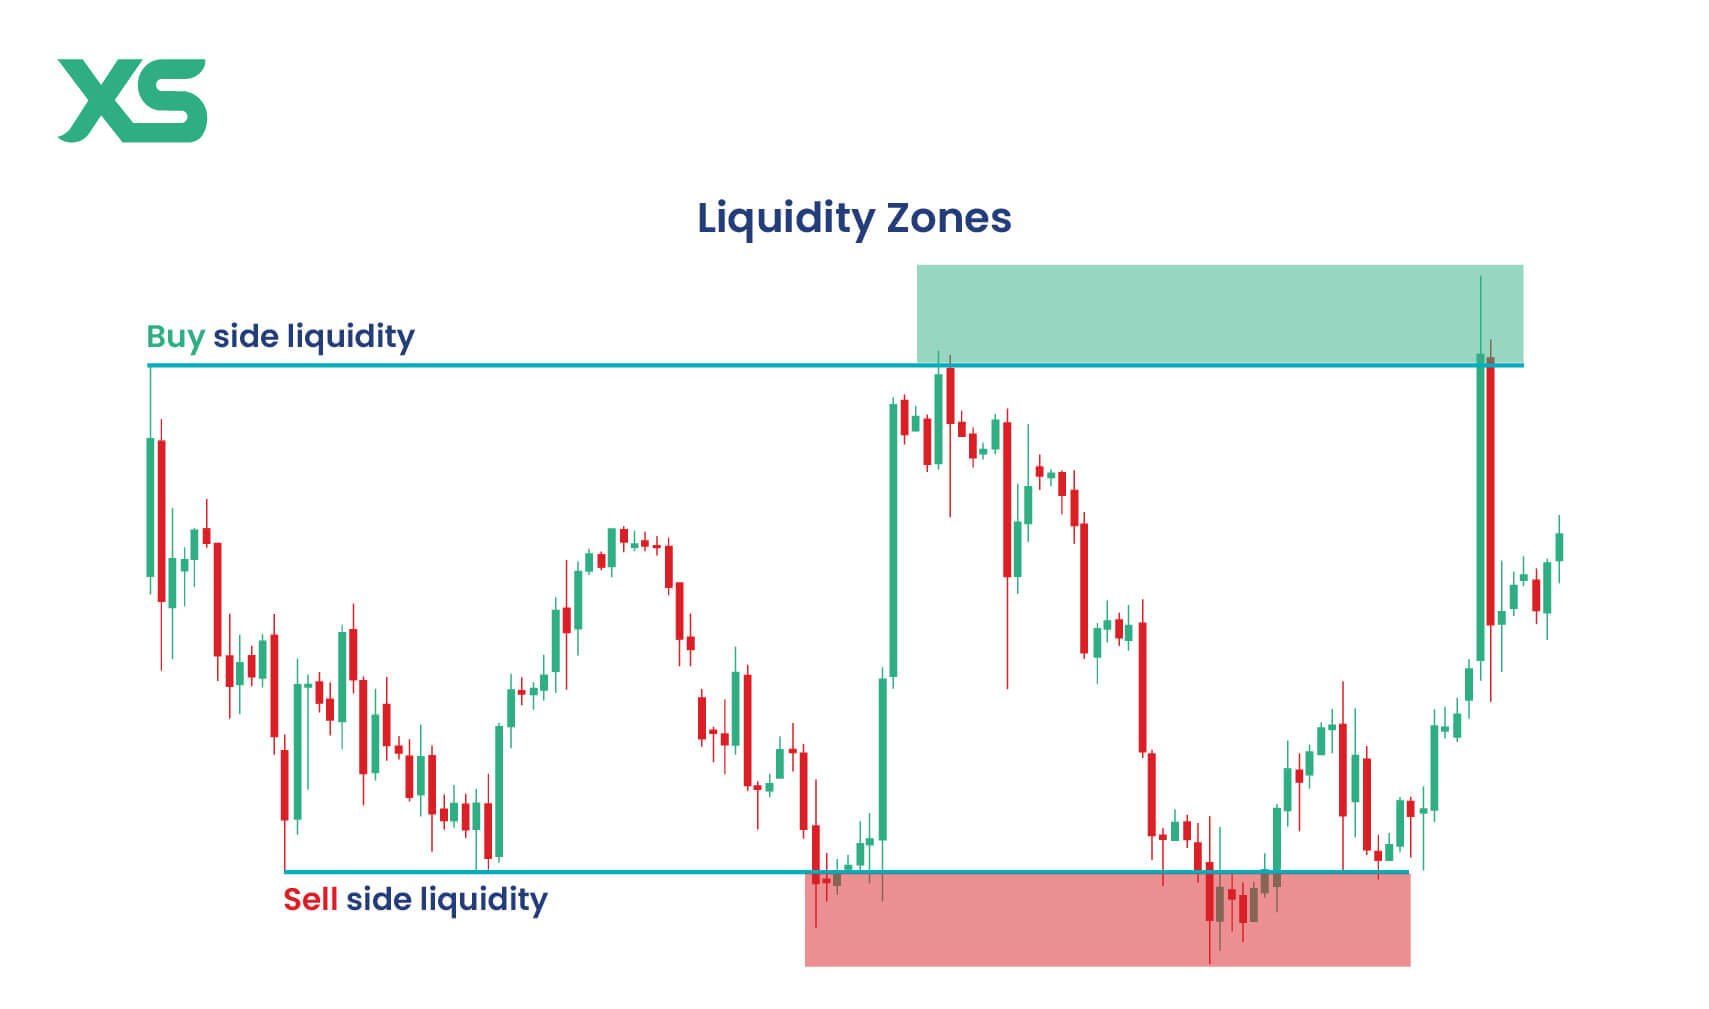
Liquidity zones refer to areas on the price chart with a high concentration of buy or sell orders.
-
Buy-side liquidity refers to the availability of buy orders at specific price levels. If a large number of buy orders are placed at a certain price, a buy-side liquidity zone forms.
-
Sell-side liquidity is the concentration of sell orders at specific price levels. When there are many sell orders at a certain price, a sell-side liquidity zone forms.
Recognizing these areas can help you predict potential price increases and decreases.
For example, while analyzing the EUR/USD, you observe a significant cluster of buy orders at 1.1850, creating a buy-side liquidity zone.
You can place a buy order slightly above this zone, expecting the price to rise due to the strong buying interest.
ICT Trading: Discount & Premium Zones
In ICT trading, discount zones are price levels considered undervalued, making them potential buy opportunities.
For example, if a currency pair's price drops below its perceived value, it enters a discount zone, suggesting a good buying opportunity.
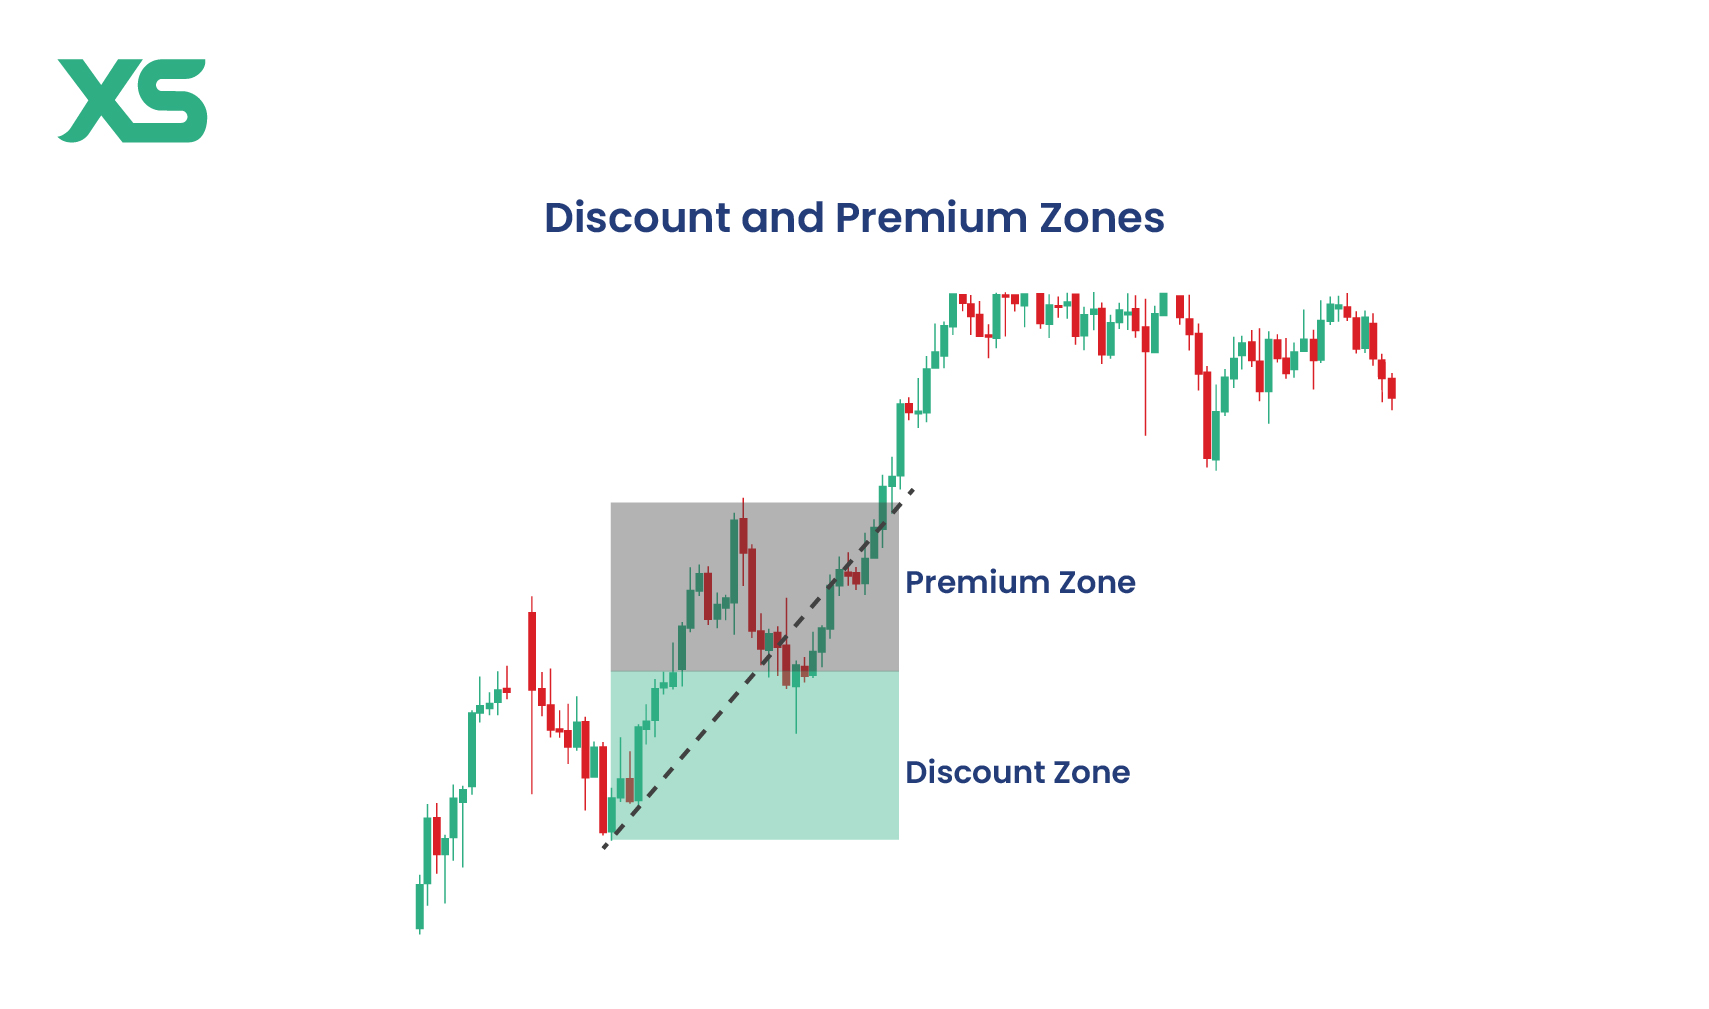
Premium zones, on the other hand, are overvalued price levels, ideal for selling.
If the price rises above its perceived value, it enters a premium zone, indicating a potential selling opportunity.
How to Identify Discount & Premium Zones
Let’s check how to correctly identify discount and premium zones:
-
Discount Zone: When the price is below the 50% retracement level of a recent range, it’s considered a discount, ideal for buying.
-
Premium Zone: When the price is above the 50% retracement, it's in a premium zone, suggesting a potential selling opportunity.
Use Fibonacci Retracement: Drawing Fibonacci levels will help you visually identify where these zones lie on the chart for better timing on entries and exits.
ICT Trading: Optimal Trade Entries
Optimal trade entries involve identifying the best moments to enter a trade based on ICT indicators and market conditions.
For instance, after identifying a discount zone, a trader might wait for a specific signal, like a bullish fair value gap, to enter a buy trade.
This concept is crucial for maximizing profit potential while minimizing risk.
ICT Trading: Fair Value Gap (Bullish & Bearish) and Inversion
A fair value gap occurs when a significant price movement creates a gap on the chart.
-
A bullish gap indicates strong buying interest, where the price jumps higher, leaving a gap.
-
A bearish gap suggests selling pressure, where the price drops significantly, leaving a gap.
These gaps can provide valuable trade entry signals. For example, a bullish gap in a discount zone may signal a strong buy opportunity.
Moreover, there’s a fair value gap inversion, which happens when a previously identified gap reverses its direction.
For instance, if a bullish gap is filled and then turns into a bearish gap, this inversion can signal a change in market sentiment, prompting traders to adjust their strategies accordingly.
How to Use Fair Value Gaps to Manage Risk and Find Optimal Entry Points
Here’s how to use fair value gaps (FVGs) to find good entry points and manage risk:
-
Wait for Retracement: After a displacement, the price often retraces back into the fair value gap. This is your optimal entry point.
-
Bullish Example: If a bullish displacement creates a gap, wait for the price to pull back into that gap before entering a buy trade.
-
Set Stop-Losses: Place your stop-loss just below the FVG to minimize risk in case the trade reverses.
-
Gap as Target: You can also use FVGs as potential price targets, expecting the market to move towards and fill these gaps.
ICT Trading: Volume Imbalance & Gaps
Volume imbalance refers to unequal buying and selling volumes at specific price levels.
If there's significantly more buying volume than selling volume at a certain price, it indicates strong demand, which can drive the price higher.
Identifying these imbalances can provide insights into potential market movements and help refine trading decisions.
ICT Trading: Order Block (Low & High Probability)
Order blocks are areas on the chart where significant buying or selling activity has occurred.
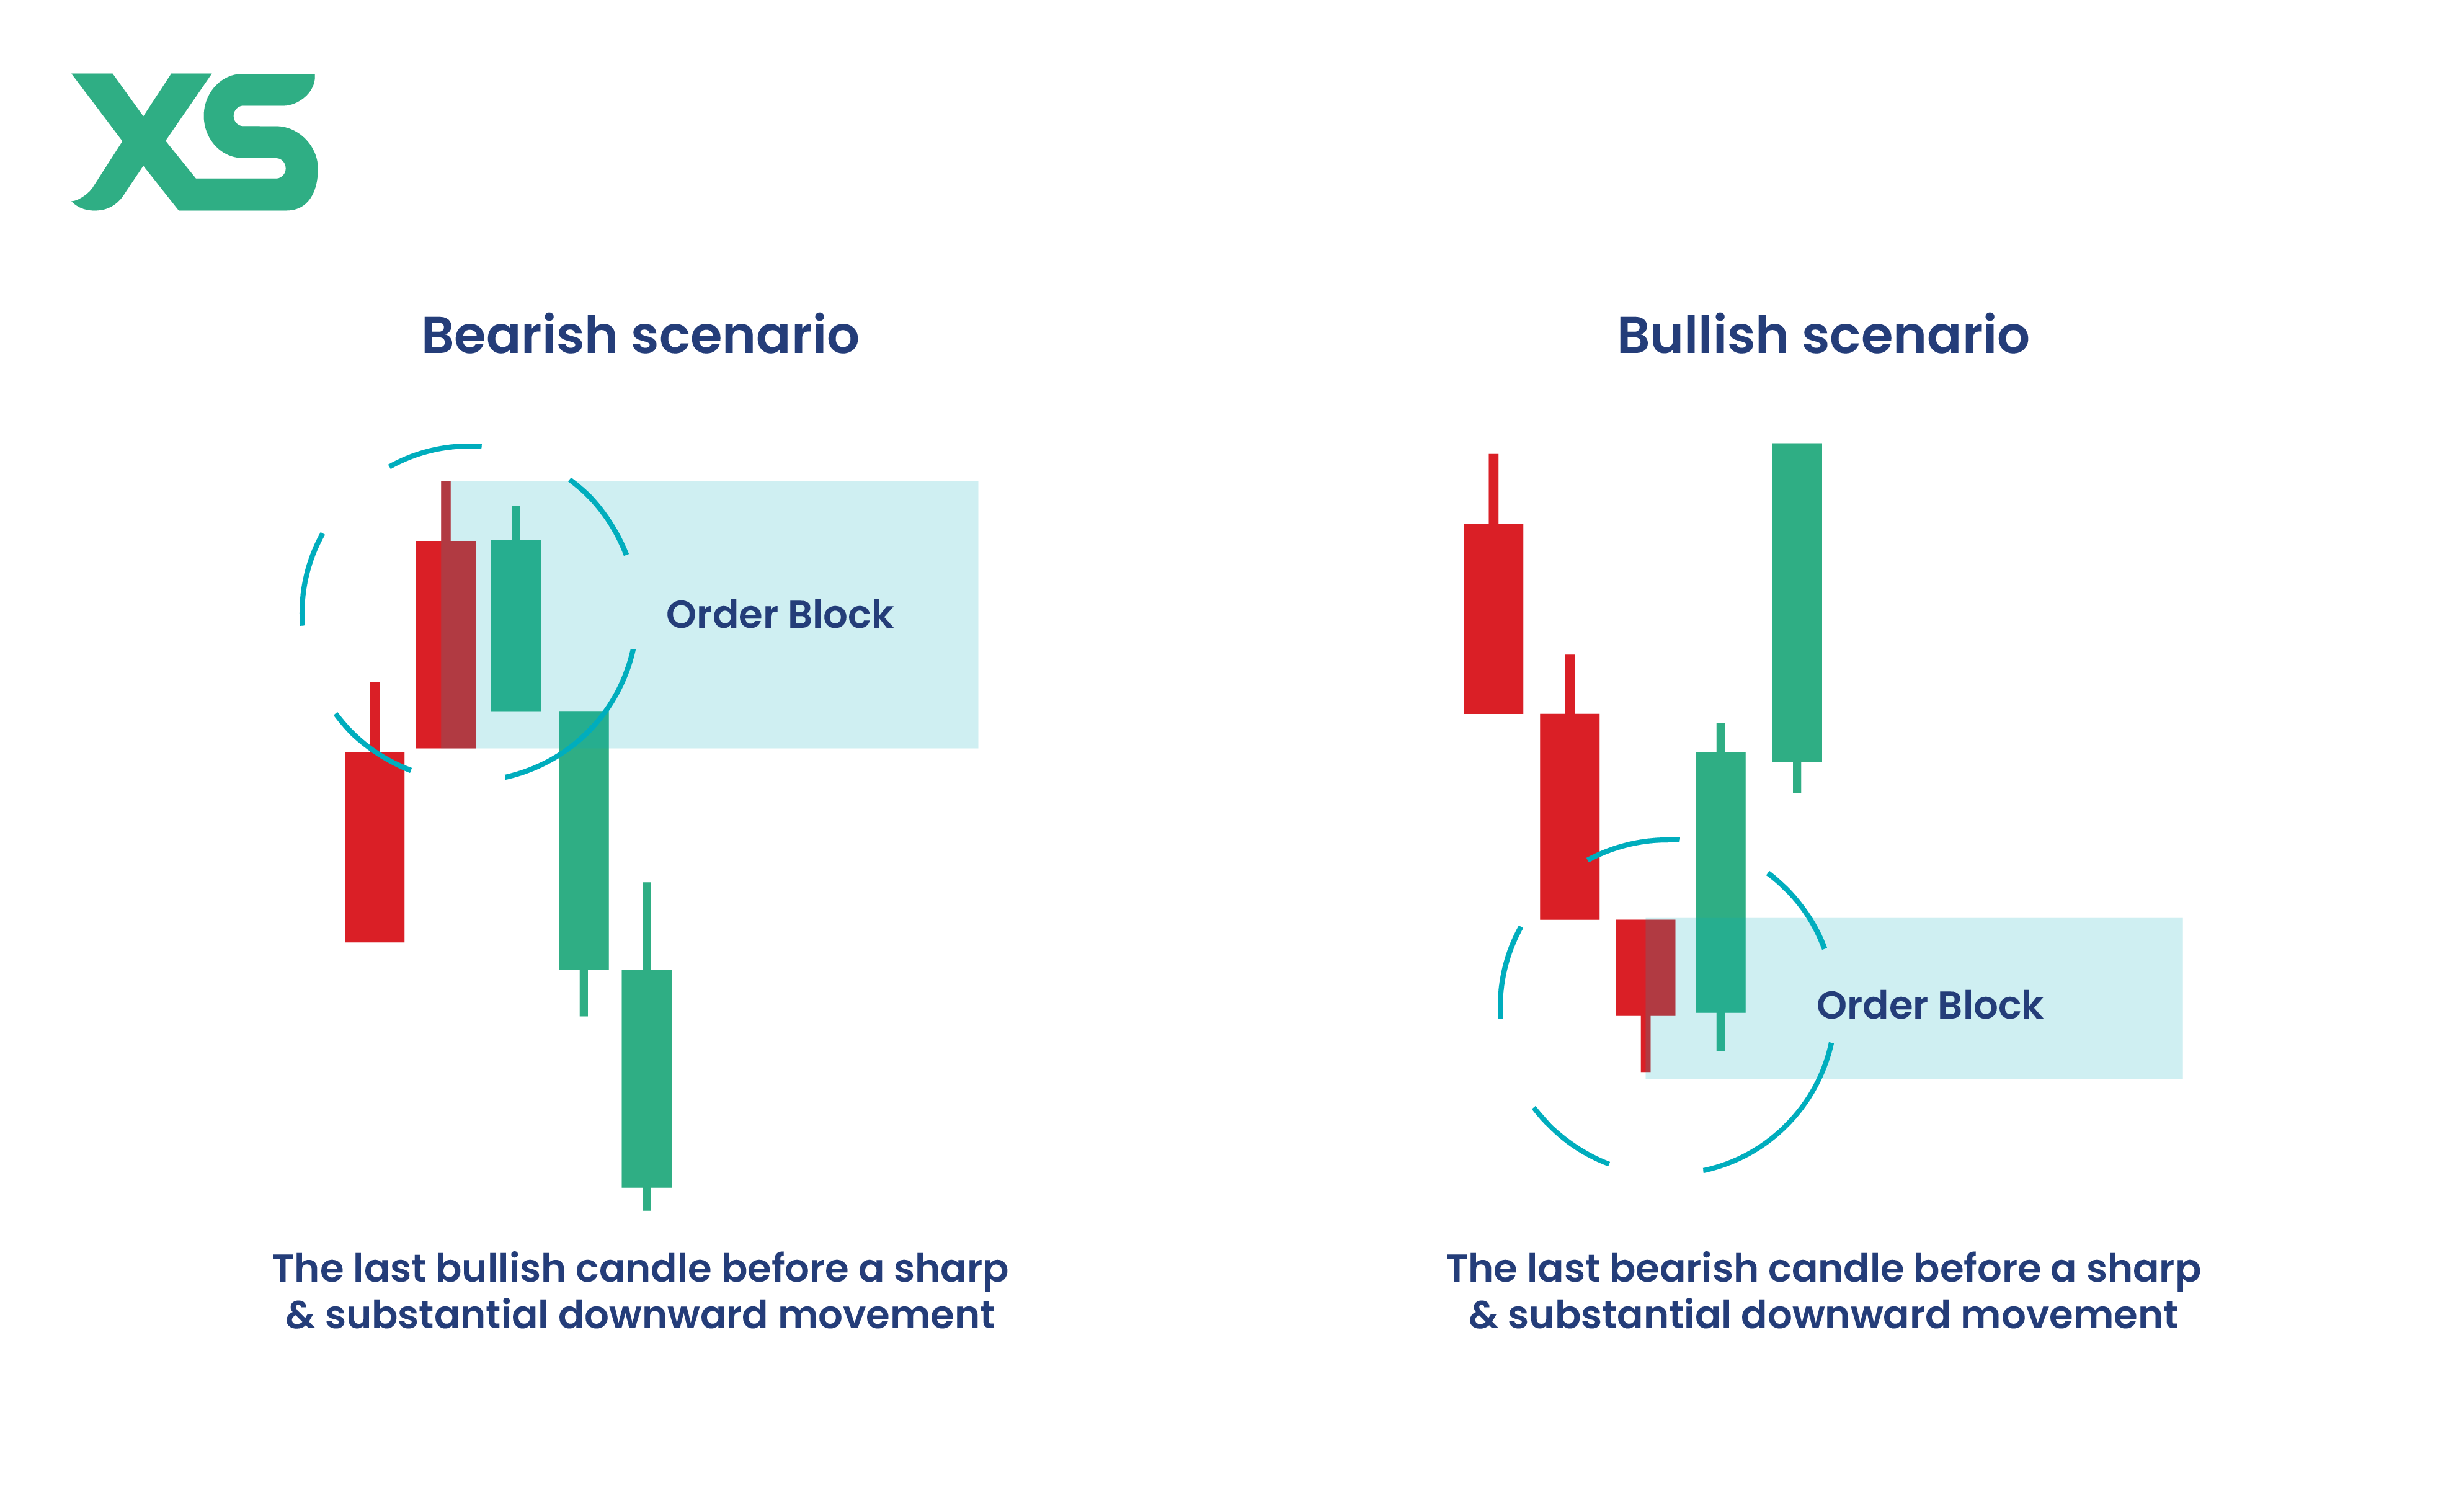
Low-probability order blocks may not always lead to substantial price movements, while high-probability order blocks are more likely to result in significant shifts.
For example, a high-probability order block might form after a strong bullish move, indicating a solid buy zone.
ICT Trading: Daily Bias
Daily bias is the overall expected market direction for the day.
By analyzing market trends and ICT indicators, traders can determine whether the bias is bullish (upward trend) or bearish (downward trend).
How to Apply Daily Bias
Here's how to develop and apply daily bias in your trading:
-
Buy in Bullish Bias: In a bullish daily bias, focus on finding optimal entry points for long trades. Look for fair value gaps or liquidity zones as potential entry levels.
-
Sell in Bearish Bias: In a bearish daily bias, you should search for opportunities to enter short positions. Again, liquidity zones and order blocks can be helpful in identifying where the price is likely to turn or continue its downward path.
Moreover, you can use daily bias in your exit strategies. For instance, if you’ve entered a trade in line with a bullish daily bias but see signs of a potential market structure shift (e.g., price moving into sell-side liquidity), consider exiting before the trend reverses.
ICT Trading: Displacement
Displacement refers to the market's movement away from an established price level.
For example, if the price of a currency pair suddenly moves away from a support level, it indicates displacement.
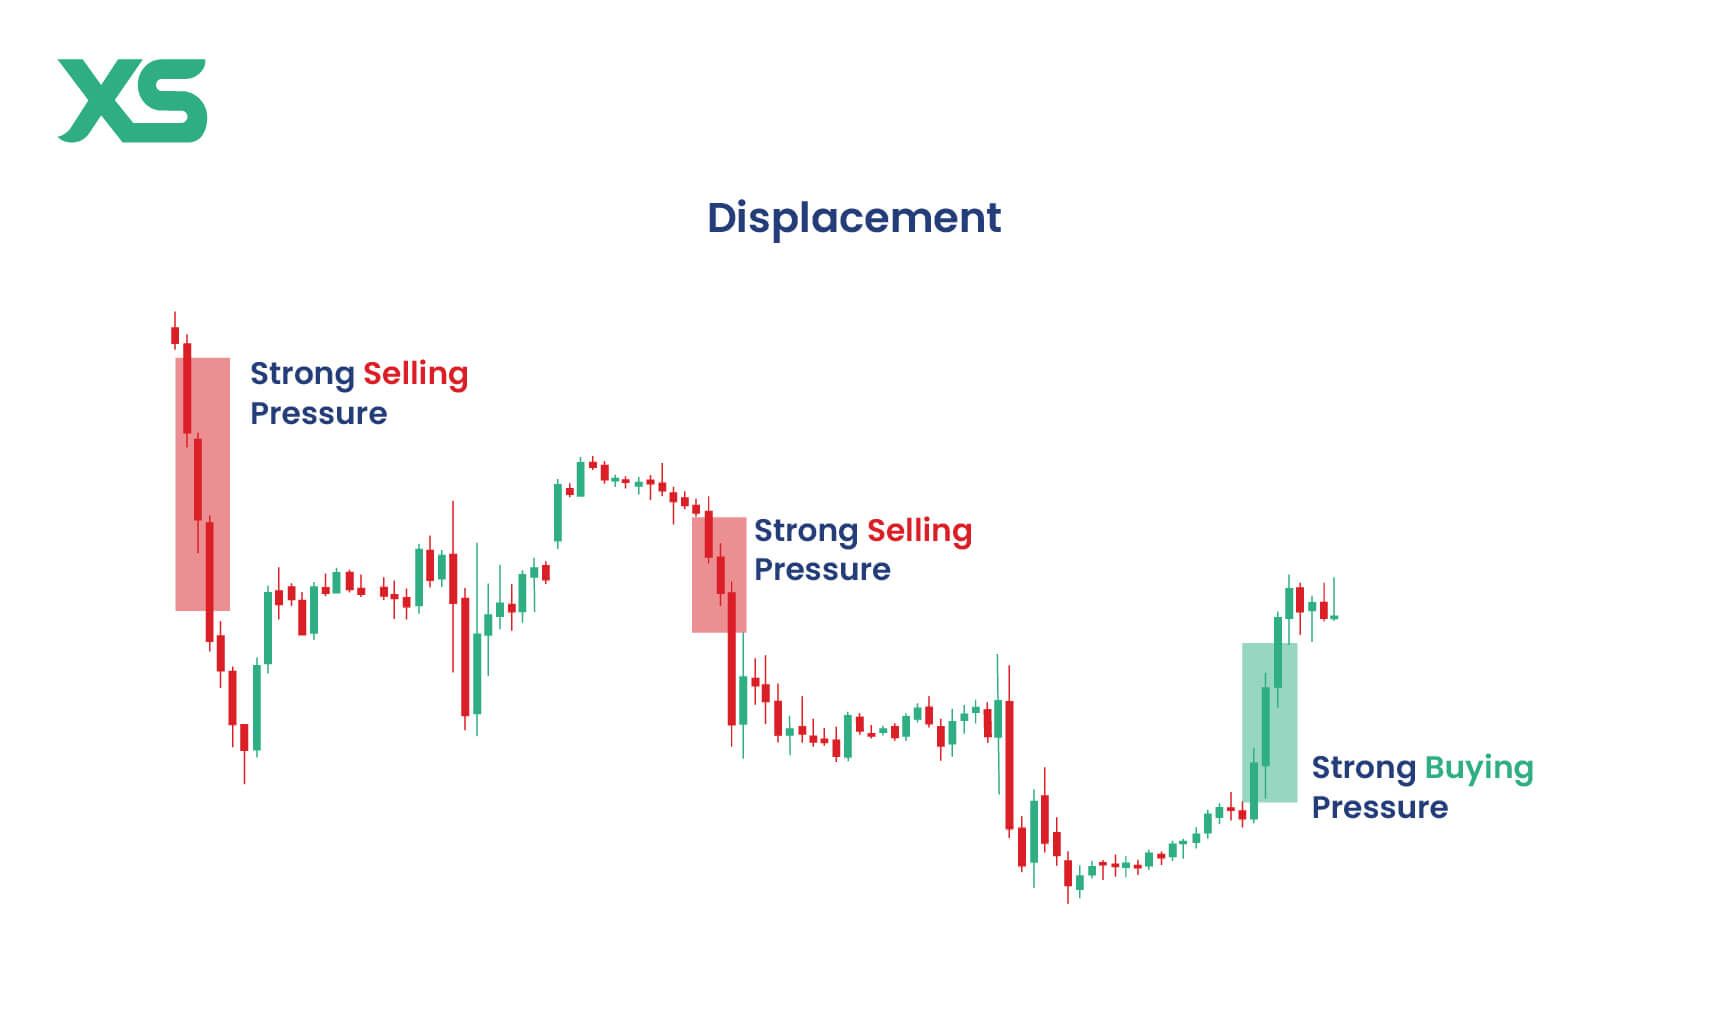
Understanding displacement helps traders anticipate potential breakouts or reversals.
How to Place a Trade Based on Displacement
To place a trade using displacement:
-
Look for Large Candles: These candles have minimal wicks and are all moving in the same direction, showing strong market momentum.
-
Combine with Liquidity Zones: After price breaks through a liquidity zone (buy-side or sell-side), wait for a displacement in the opposite direction.
-
Enter your Trade: For example, if price breaks above a buy-side liquidity zone and you see strong bullish candles, place a buy trade.
Risk Management: Set your stop-loss just below the last significant low to minimize risk.
ICT Trading Methods
Now that we've covered the foundational concepts of ICT trading, let's explore the specific methods for effectively applying these principles.
-
Market structure analysis involves understanding the overall arrangement of price action to identify trends, key levels, and potential reversal points.
You can align your strategy by recognizing whether the market is in an uptrend, downtrend, or range-bound. -
Order flow analysis involves identifying liquidity zones, such as buy-side and sell-side areas. For example, spotting a cluster of buy orders at a certain level forms a buy-side zone.
Placing a buy order just above this zone lets you capitalize on the expected price rise. -
Using ICT Indicators such as fair value gaps and order blocks that help you pinpoint optimal entry and exit points by highlighting areas of significant buying or selling activity.
Step-by-Step ICT Trading Strategy
The ICT (Inner Circle Trader) strategy helps you identify high-probability setups using market structure, liquidity, and smart money concepts.
Here’s a concise step-by-step guide to applying it with the ascending triangle pattern:
-
Identify Market Structure: Confirm a bullish trend with higher highs and lows to align with the ascending triangle pattern.
-
Spot Liquidity Zones: Identify liquidity buildup near resistance, signaling a potential breakout.
-
Smart Money Confirmation: Look for a high-volume breakout followed by a retest of resistance as support.
-
Confirm Entry: Use RSI or MACD to validate momentum before entering after support holds.
-
Set Stop Loss & Take Profit: Place stop loss below breakout; set profit target by projecting the triangle’s height.
-
Monitor Institutional Activity: Track market trends, order flows, and news to adjust your strategy.
Following these steps ensures a structured approach to trading the ascending triangle with ICT principles, improving trade accuracy and risk management.
ICT Trading Pros and Cons
ICT trading has proven to be beneficial for multiple traders, but it also has its own limitations.
Pros
-
Provides a comprehensive view of market mechanics.
-
Focuses on informed and strategic decision-making.
-
Extensive educational material is available from Michael J. Huddleston.
-
Helps traders align their strategies with institutional actions.
Cons
-
Requires a deep understanding of various concepts and techniques.
-
Involves significant time investment for learning and analysis.
-
Challenging for beginners to master initially.
-
Can lead to analysis paralysis if not managed properly.
What's an ICT Trade?
An ICT trade is a strategy that follows institutional market movements, using liquidity and market structure to find high-probability setups. ICT trades often rely on concepts like order blocks, fair value gaps, and liquidity sweeps to capitalize on market inefficiencies.
Conclusion
ICT trading offers a unique approach to trading by focusing on institutional strategies and market manipulation patterns.
Mastering concepts like swing points, liquidity zones, and fair value gaps can improve your market analysis and make you make more informed decisions.

Get the latest insights & exclusive offers delivered straight to your inbox.
Table of Contents
FAQs
ICT, or Inner Circle Trader, is a trading strategy developed by Michael J. Huddleston that focuses on institutional trading strategies and market analysis.
ICT trading can be profitable if traders thoroughly understand and effectively implement its concepts and strategies.
To become an ICT trader, start by learning from Michael J. Huddleston's educational resources, practice regularly, and apply ICT concepts in your trading.
ICT plays a significant role in trade by providing traders with tools and techniques to analyze market movements, predict trends, and make informed trading decisions.
To handle false signals in ICT trading, it's important to confirm trades with multiple indicators or patterns. Don’t rely on just one concept like a fair value gap or liquidity zone.
Look for confluence, such as displacement and market structure shifts, to increase the accuracy of your signals. Always use stop-loss orders to manage risk in case a signal turns out to be false.
The biggest challenges for beginners using ICT trading are understanding the complexity of institutional-level strategies and mastering the patience required to wait for optimal trade setups.
There’s also a steep learning curve with concepts like liquidity zones and displacement, which can feel overwhelming at first.
This written/visual material is comprised of personal opinions and ideas and may not reflect those of the Company. The content should not be construed as containing any type of investment advice and/or a solicitation for any transactions. It does not imply an obligation to purchase investment services, nor does it guarantee or predict future performance. XS, its affiliates, agents, directors, officers or employees do not guarantee the accuracy, validity, timeliness or completeness of any information or data made available and assume no liability for any loss arising from any investment based on the same. Our platform may not offer all the products or services mentioned.


