Forex
Earnings Per Share (EPS): Calculation, Types, and Examples
Written by Sarah Abbas
Fact checked by Antonio Di Giacomo
Updated 8 November 2024

Table of Contents
Earnings Per Share (EPS) is a financial metric representing the portion of a company's profit allocated to each outstanding share of common stock.
Investors and analysts use EPS to assess a company's profitability and make informed decisions about stock valuation.
In this article, you'll learn how EPS influences stock performance and what it reveals about a company's financial health.
Key Takeaways
-
Earnings Per Share (EPS) shows how much profit a company makes for each share of stock, helping investors understand its profitability.
-
Basic, diluted, and adjusted EPS each give a slightly different view of earnings, from straightforward to accounting for extra potential shares or one-time costs.
-
EPS is most useful when combined with other measures, like the Price-to-Earnings (P/E) ratio, to get a complete picture of a company’s financial health.
Try a No-Risk Demo Account
Register for a free demo and refine your trading strategies.
Open Your Free Account
What Is Earnings Per Share (EPS)?
Earnings Per Share (EPS) measures a company’s profit per outstanding share of its common stock, helping investors understand how profitable it is on a per-share basis.
EPS is essential for comparing companies within the same industry, especially when analyzing stock performance.
A higher EPS generally indicates higher profitability, which can appeal to investors as it suggests that each share holds more value.
For public companies, EPS is a regularly reported figure that analysts use to track profitability trends and evaluate growth potential.
While it’s a significant indicator of financial health, EPS is most meaningful when considered with other metrics, such as the Price-to-Earnings (P/E) ratio or Return on Equity (ROE), to give a well-rounded view of a company’s financial performance.
Earnings Per Share (EPS) Formula
Here’s how to calculate EPS:
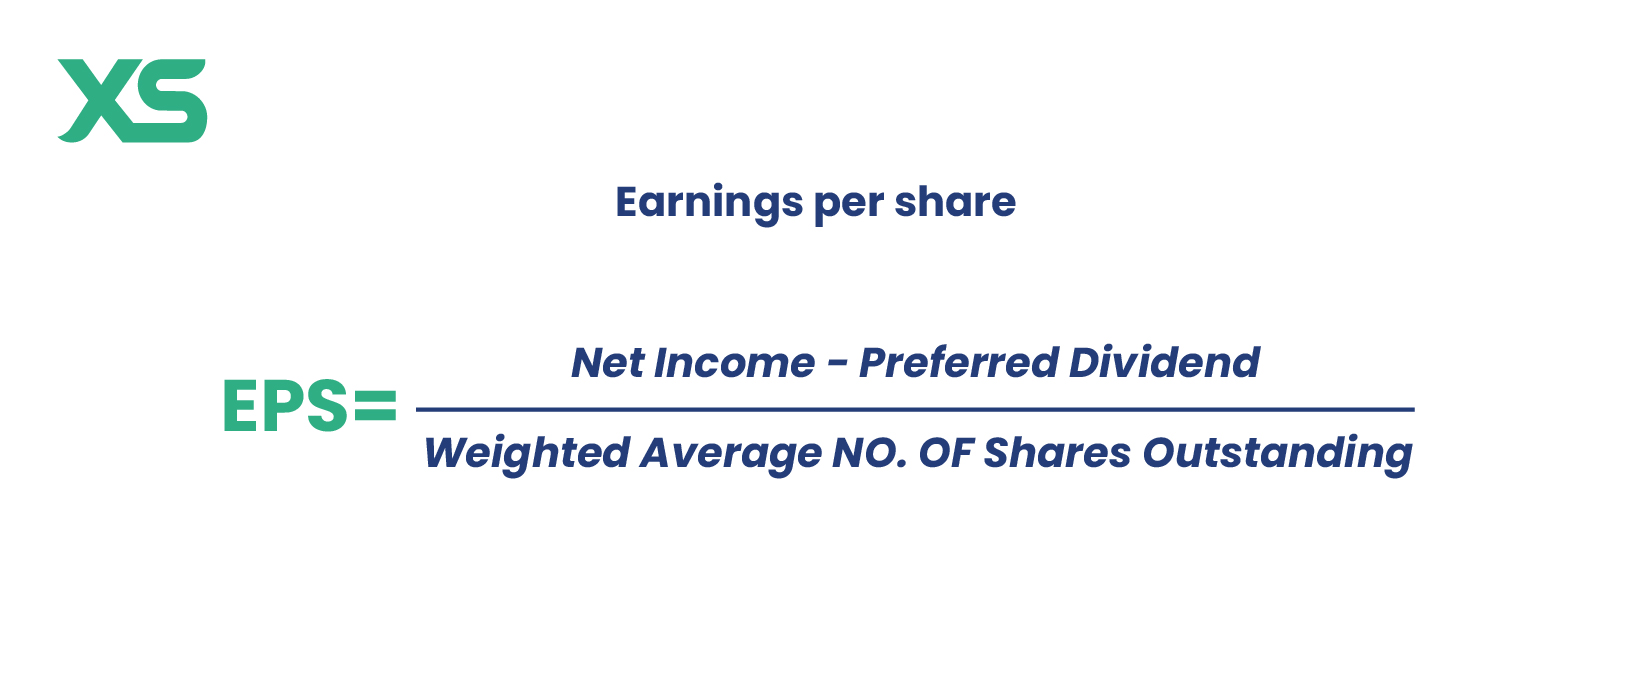
Breakdown of the EPS Formula
-
Net Income: This is the company’s total earnings after subtracting all expenses, taxes, and costs.
-
Preferred Dividends: If a company has preferred shares, dividends paid on them are subtracted from the net income since they are unavailable to common shareholders.
-
Weighted Average Shares Outstanding: This reflects the average number of shares held by investors over a specific period, adjusted for any stock splits or share buybacks.
Types of EPS
EPS can vary depending on adjustments made in the calculation.
Basic EPS
Basic EPS calculates the profit per share based only on the shares currently held by investors. It doesn’t consider any additional shares that could be issued from stock options or convertible securities, which might dilute (or reduce) earnings per share.
Basic EPS is the simplest way to measure earnings per share but may not give a complete picture if the potential shares that could affect earnings.
Diluted EPS
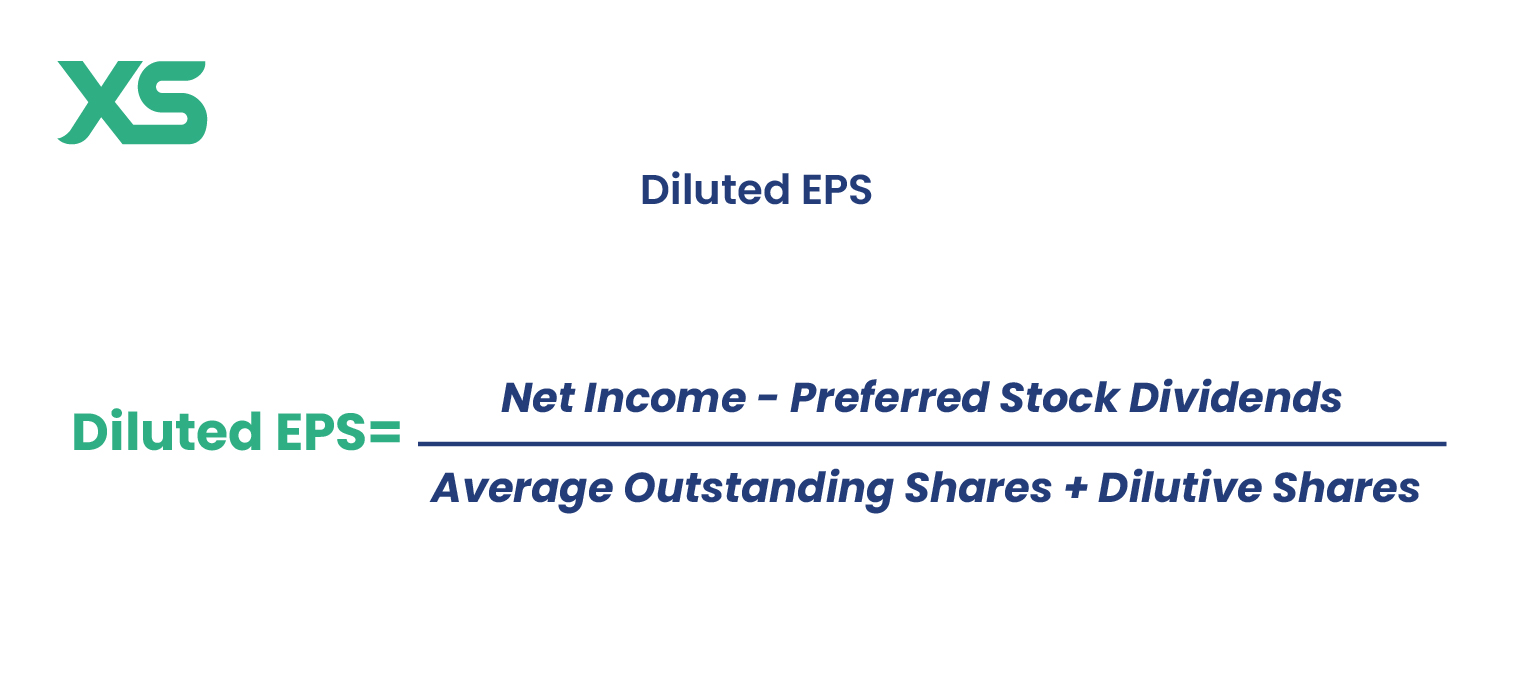
Diluted EPS includes all possible shares that could be converted to common stock, such as stock options, convertible debt, and preferred shares.
This calculation gives a “worst-case” scenario for earnings per share, showing what EPS would be if all potential shares were converted.
Because it includes everything that could dilute the earnings per share, diluted EPS is more conservative and offers a fuller view of potential profitability.
Adjusted EPS
Adjusted EPS removes certain expenses or income that may not reflect the company’s usual operations to provide a clearer view of ongoing profitability.
Companies sometimes exclude one-time costs, like restructuring charges or legal expenses, from the EPS calculation to give investors a better sense of the core earnings power of the business.
This type of EPS helps investors focus on what the company is likely to earn in the future, without temporary or unusual costs.
Examples of EPS Calculation
Understanding EPS calculations with real examples makes it easier to see how EPS figures are derived and applied.
-
Example of Basic EPS Calculation:
-
Net Income: $1,000,000
-
Preferred Dividends: $50,000
-
Weighted Average Shares Outstanding: 500,000
-
Basic EPS = 1,000,000-50,000/500,000 = 1.90
-
This result indicates that each outstanding share generated $1.90 in earnings.
-
-
Example of Diluted EPS Calculation:
-
Net Income: $1,000,000
-
Preferred Dividends: $50,000
-
Weighted Average Shares Outstanding (Including Potential Dilution): 550,000
-
Diluted EPS = 1,000,000-50,000/550,000 = 1.73
-
The diluted EPS is slightly lower, showing that if all potential shares were issued, each share would be worth $1.73 in earnings.
-
-
Example of Adjusted EPS Calculation:
-
Adjusted Net Income (excluding one-time expense): $1,200,000
-
Weighted Average Shares Outstanding: 500,000
-
Adjusted EPS = 1,200,000/500,000 = 2.40
-
Adjusted EPS may show a higher per-share profit by removing non-recurring expenses, giving a clearer view of ongoing profitability.
-
Interpreting EPS Results
EPS is a valuable metric for assessing a company’s financial performance, but understanding its implications is equally important.
-
High EPS: A high EPS generally reflects strong profitability, making a company more attractive to investors. It suggests that each share represents a substantial portion of earnings.
-
Low EPS: A low EPS can indicate lower profitability. However, some sectors, like startups or tech companies, may have lower EPS but strong growth potential.
-
EPS Growth Trends: Consistent growth in EPS over time suggests a healthy, expanding business. Investors often look for upward EPS trends as a positive sign of performance.
EPS is often compared with industry averages or competitors. If a company’s EPS consistently outperforms its peers, it may indicate a competitive advantage in efficiency or profitability.
What Are the Limitations of EPS?
While EPS is a valuable metric, it has several limitations:
-
Does Not Consider Debt: EPS ignores the company’s level of debt, which can be a critical factor in evaluating financial health. Companies with high debt may show a high EPS but still have underlying financial risks.
-
Subject to Accounting Manipulation: Companies may adjust accounting methods to boost EPS, such as share buybacks or excluding certain expenses. This can make EPS an unreliable measure of true profitability.
-
Limited on Its Own: EPS alone doesn’t provide a complete picture of a company’s financial health. It’s best interpreted alongside other financial ratios, like the P/E ratio and ROE.
EPS vs. Other Financial Ratios
To get a complete picture of a company’s performance, comparing EPS with other financial ratios is helpful. Here’s how EPS measures up to some other standard metrics:
EPS vs. P/E Ratio
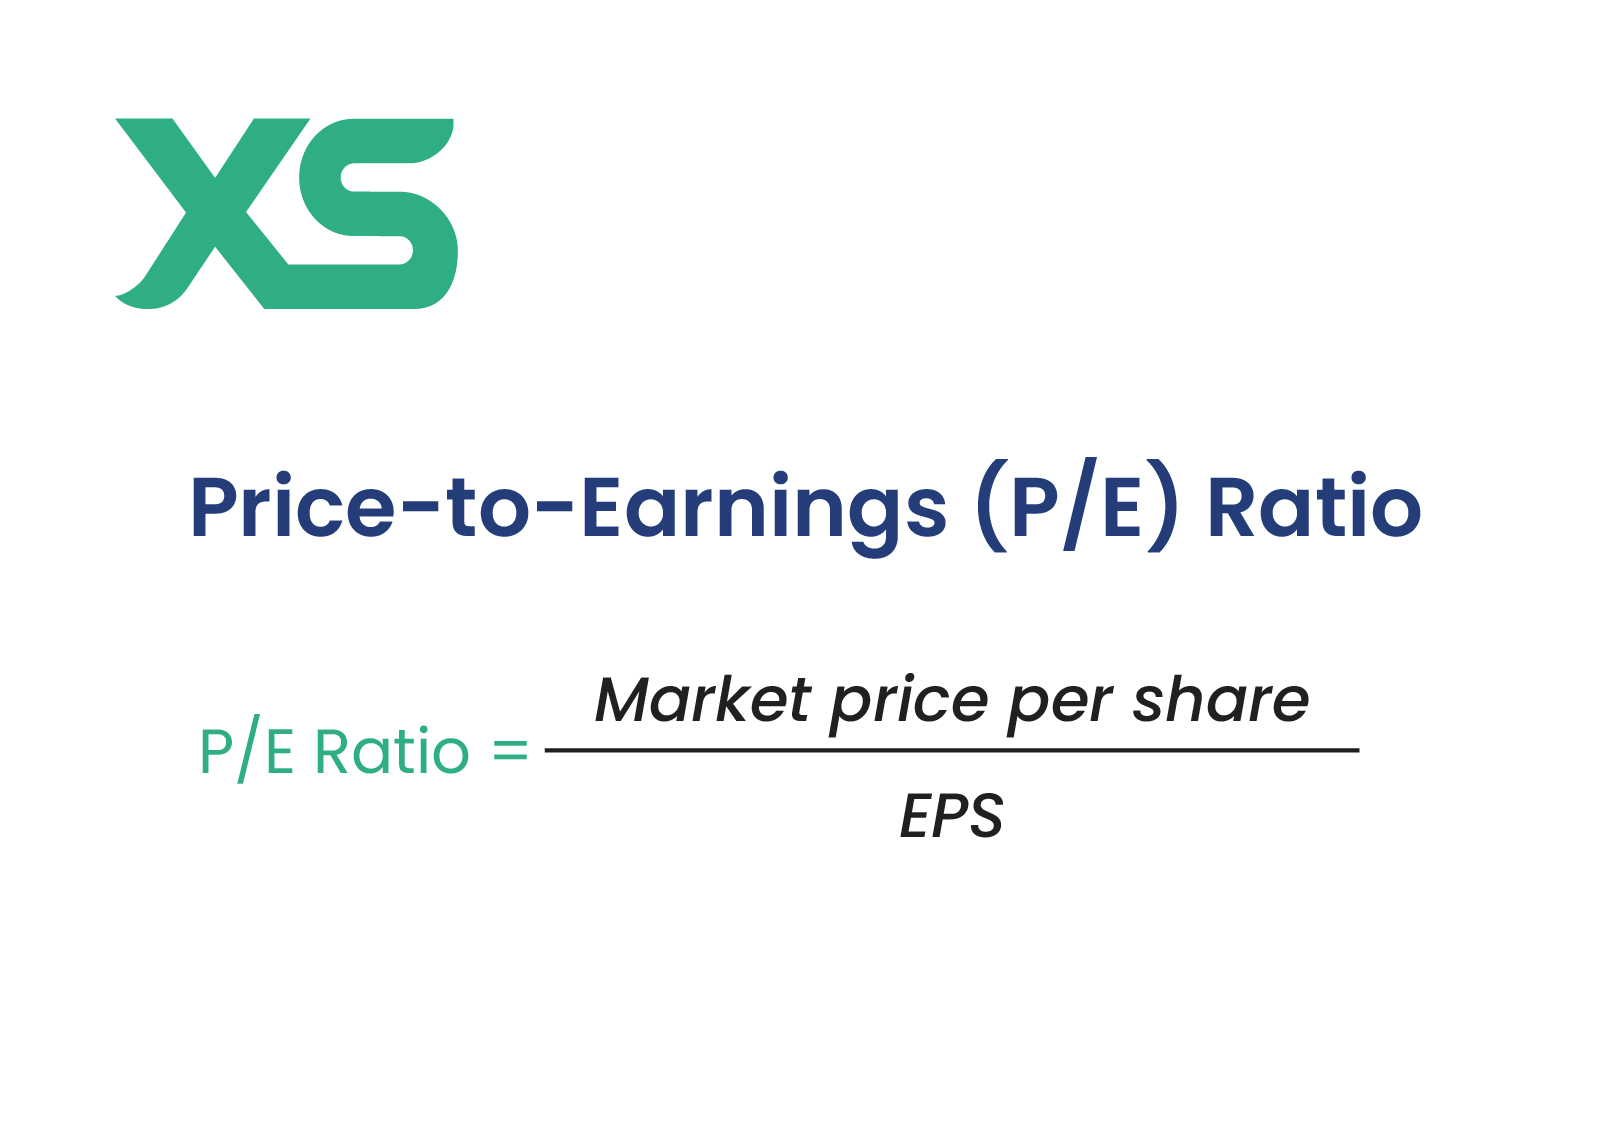
The Price-to-Earnings (P/E) ratio compares a company’s stock price to its EPS, showing how much investors are willing to pay for each dollar of earnings.
While EPS measures a company’s profit per share, the P/E ratio reflects how investors feel about the company.
A high P/E ratio might mean investors expect the company to grow, while a low P/E could suggest the stock is undervalued.
EPS vs. Return on Equity (ROE)
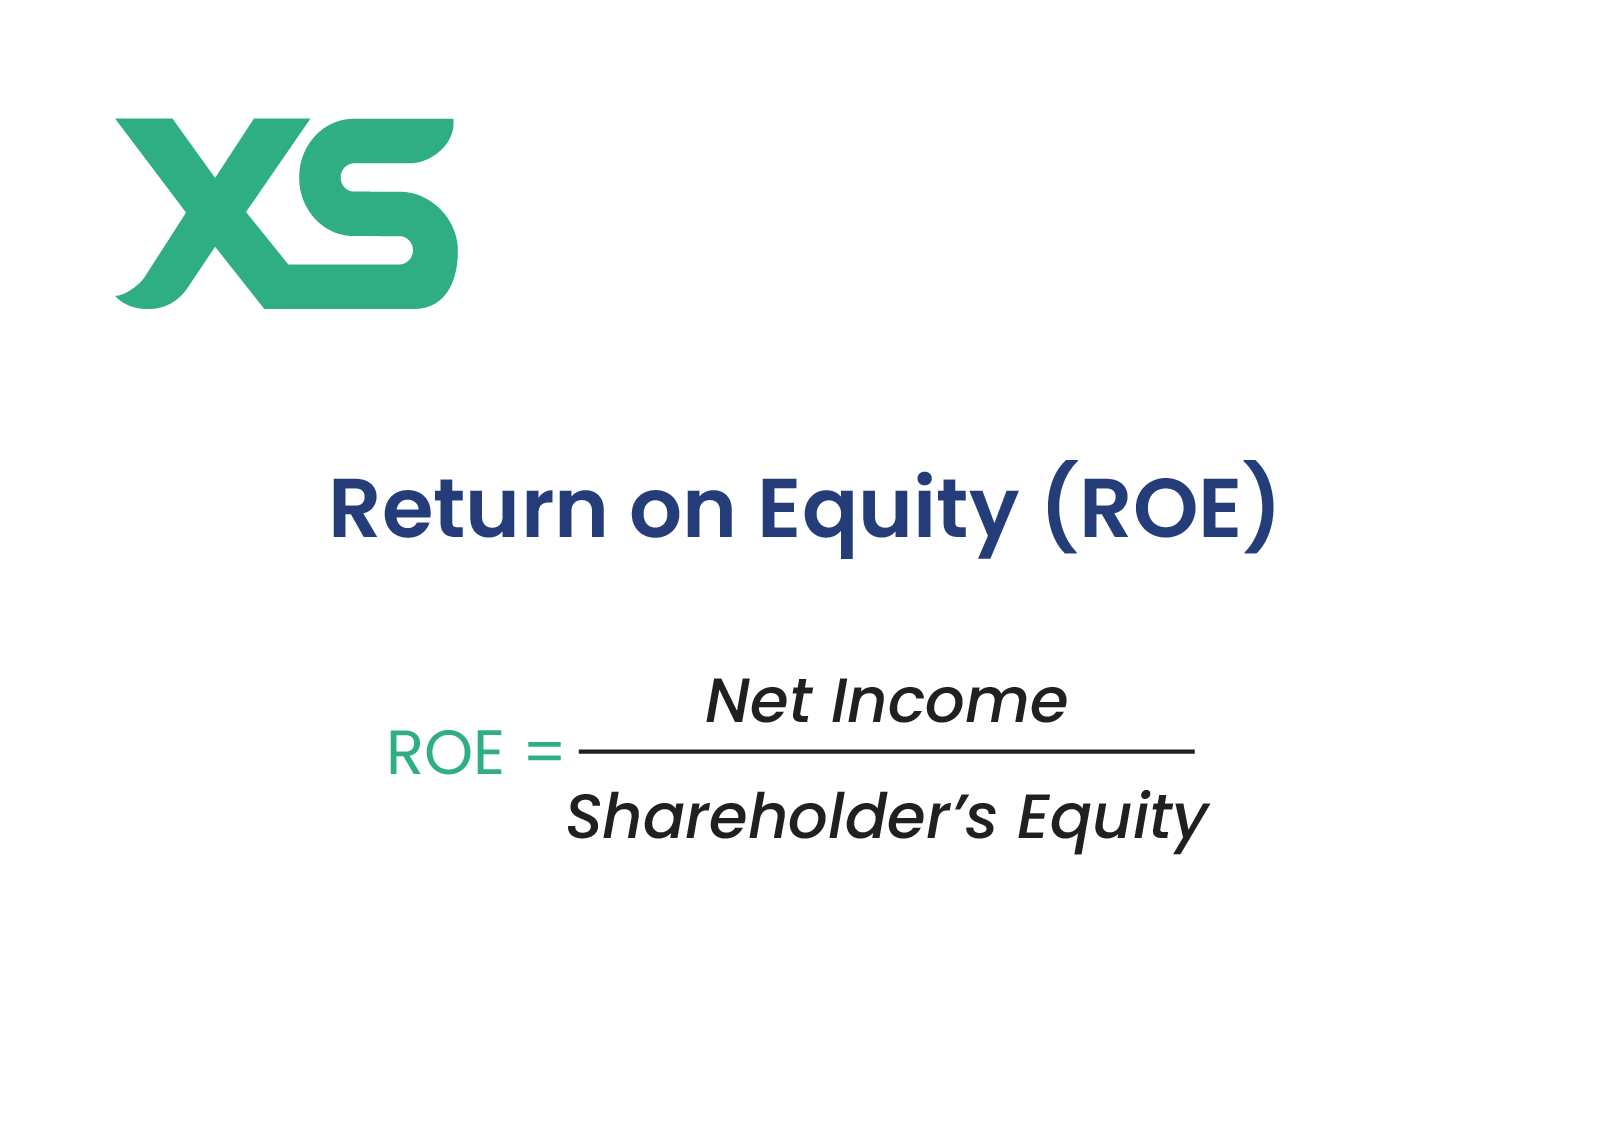
Return on Equity (ROE) measures how well a company uses its shareholders’ equity to make a profit.
ROE is calculated by dividing net income by shareholders’ equity. While EPS focuses on profit per share, ROE shows how efficiently the company uses all its resources.
Both are useful, but ROE gives a broader view of profitability by looking at the overall equity, not just per-share earnings.
EPS vs. Dividend Per Share (DPS)
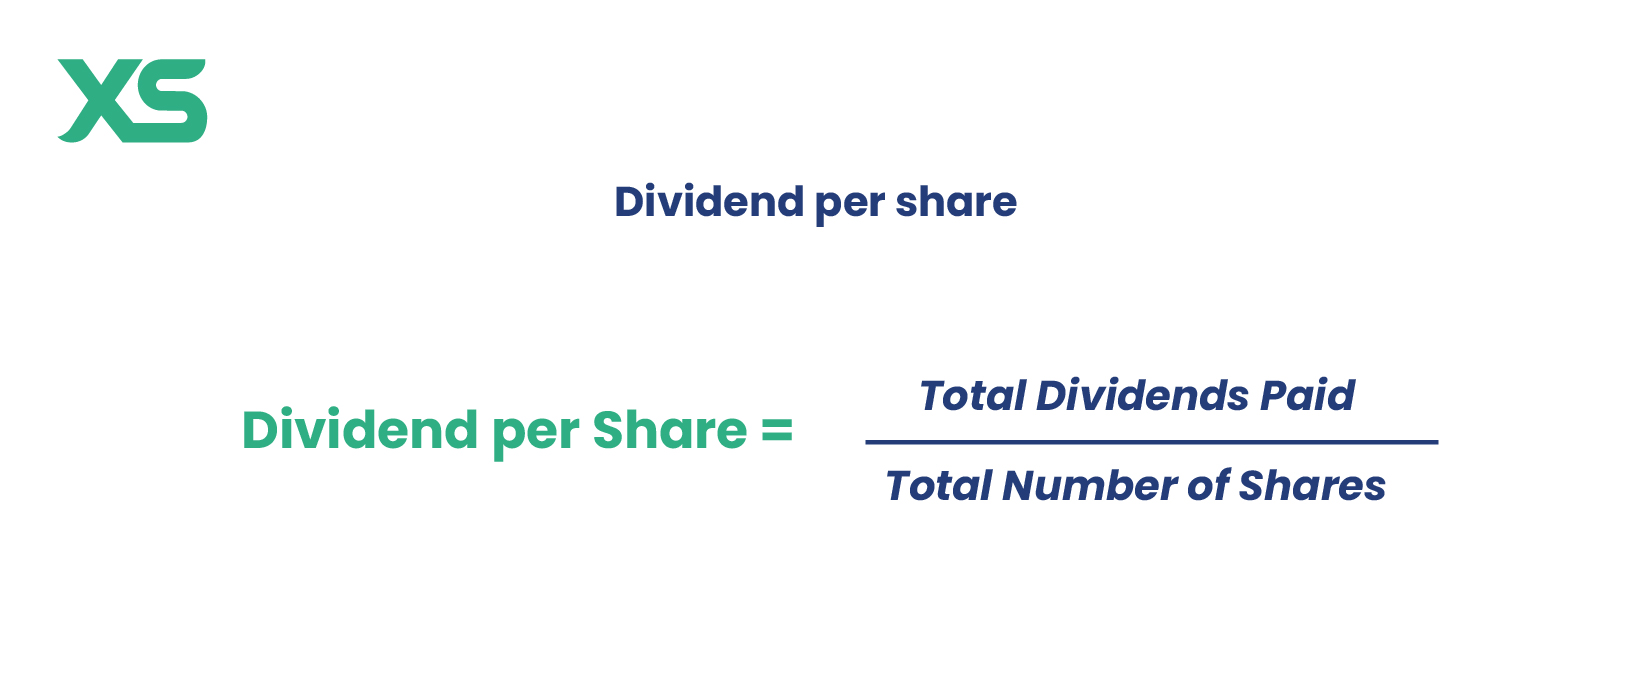
Dividend Per Share (DPS) tells us how much of the company’s earnings are given out as dividends to shareholders.
Companies with high EPS may reinvest their earnings instead of paying dividends, especially if they’re focused on growth.
DPS shows a company’s ability to pay dividends, while EPS shows overall profitability. Together, EPS and DPS help investors understand how much profit is made versus how much is shared with shareholders.
Conclusion
Earnings Per Share (EPS) is a key metric in financial analysis that helps investors understand how profitable a company is for each share of stock.
By looking at the different types of EPS—basic, diluted, and adjusted—investors get a clearer picture of the company's earnings per share, even if more shares might be issued in the future or if certain costs are adjusted.
However, EPS alone doesn’t tell the whole story. It’s best understood when combined with other metrics like the Price-to-Earnings (P/E) ratio, Return on Equity (ROE), and Dividend Per Share (DPS).
Follow XS for more educational content!

Get the latest insights & exclusive offers delivered straight to your inbox.
Table of Contents
FAQs
A good EPS depends on the industry and the company's size, but generally, higher EPS is seen as a sign of profitability and financial health. It also indicates the company’s ability to generate income per share, which can make it more attractive to investors.
Yes, a company can have a negative EPS if it has more expenses than income during a specific period, resulting in a net loss. Negative EPS is common for new or rapidly growing companies that are investing heavily in their operations.
EPS is typically reported every quarter and annually. You can find EPS in a company’s financial statements, especially in earnings reports and annual filings like the 10-K, which are often available on the company’s investor relations website or on financial platforms.
EPS can impact dividends because companies with higher EPS are more likely to have the profits needed to pay dividends to shareholders. However, not all companies with high EPS pay dividends, as some prefer to reinvest earnings back into the business for growth.
Basic EPS is calculated using only currently outstanding shares, while diluted EPS includes potential shares from options, convertible securities, or other sources that could dilute earnings per share. Diluted EPS provides a more conservative view of a company's profitability per share.
This written/visual material is comprised of personal opinions and ideas and may not reflect those of the Company. The content should not be construed as containing any type of investment advice and/or a solicitation for any transactions. It does not imply an obligation to purchase investment services, nor does it guarantee or predict future performance. XS, its affiliates, agents, directors, officers or employees do not guarantee the accuracy, validity, timeliness or completeness of any information or data made available and assume no liability for any loss arising from any investment based on the same. Our platform may not offer all the products or services mentioned.


