Forex
Confluence in Trading: How to Combine Indicators for Success
Written by Nathalie Okde
Fact checked by Rania Gule
Updated 7 November 2024

Table of Contents
Confluence in trading means combining multiple technical indicators and tools to confirm signals. In trading, relying on a single signal can often lead to unreliable decisions and false setups. This is why confluence is very beneficial.
Key Takeaways
-
Confluence in trading combines multiple signals to improve trade accuracy.
-
It helps filter out false signals, leading to more confident and informed decisions.
-
Clear entry and exit points enhance risk management in confluence trading.
-
Confluence trading can be applied across various markets and timeframes.
Try a No-Risk Demo Account
Register for a free demo and refine your trading strategies.
Open Your Free Account
What Is Confluence in Trading?
Confluence in trading refers to the alignment of different technical indicators, chart patterns, or analytical tools to confirm a trading decision.
Instead of depending on just one signal, you use confluence to combine several signals, which strengthens the decision to enter or exit a trade.
For example, if a resistance level aligns with a bearish candlestick pattern, and a moving average crossover points downward, a trader using confluence in trading would see this as a stronger signal to enter a short position.
This is more reliable than relying on any of those signals individually.
What Is a Confluence Zone?
A confluence zone is an area on a chart where multiple forms of technical analysis—such as support and resistance levels, moving averages, and trend lines—come together.
These zones often act as significant price levels where a trader can expect a reversal, breakout, or continuation of a trend.
The advantage of confluence zones is that they help traders spot areas with higher chances of market reaction. For instance, if both a key support level and a Fibonacci retracement line meet at a specific price, this would be a confluence zone.
Identifying confluence zones helps you focus on areas where the market is more likely to respond, reducing the chances of getting caught in a false breakout or reversal.
Why Is Confluence Important in Trading?
Confluence is important because it increases the reliability of trade setups. The financial markets are filled with noise, and using a single indicator can often lead to false signals.
However, by combining multiple factors, you filter out much of the noise, allowing for more informed and confident trading decisions.
This approach also increases the probability of a successful trade by providing more confirmation.
Confluence in Different Market Conditions
Now that you understand the importance of confluence in trading, you might be wondering where you can apply it.
Confluence can be applied across various market conditions, helping you adapt your strategies depending on volatility, asset type, and market structure.
Confluence in Volatile Markets
In highly volatile markets, such as those seen during economic news releases or in emerging markets, price movements can be unpredictable.
Relying on a single indicator can lead to false signals or being caught in sharp reversals. Confluence trading is critical in these environments because it provides multiple layers of confirmation.
By combining indicators like the Average True Range (ATR) for volatility measurement, support and resistance levels, and chart patterns, you can confirm setups and reduce the risk of being misled by sudden price spikes or dips.
Confluence in Sideways or Range-Bound Markets
When the market is trading within a range without clear trends, confluence can still be beneficial.
In these conditions, combining oscillators like the Relative Strength Index (RSI) with support and resistance levels can help traders identify potential reversal points near the top or bottom of the range.
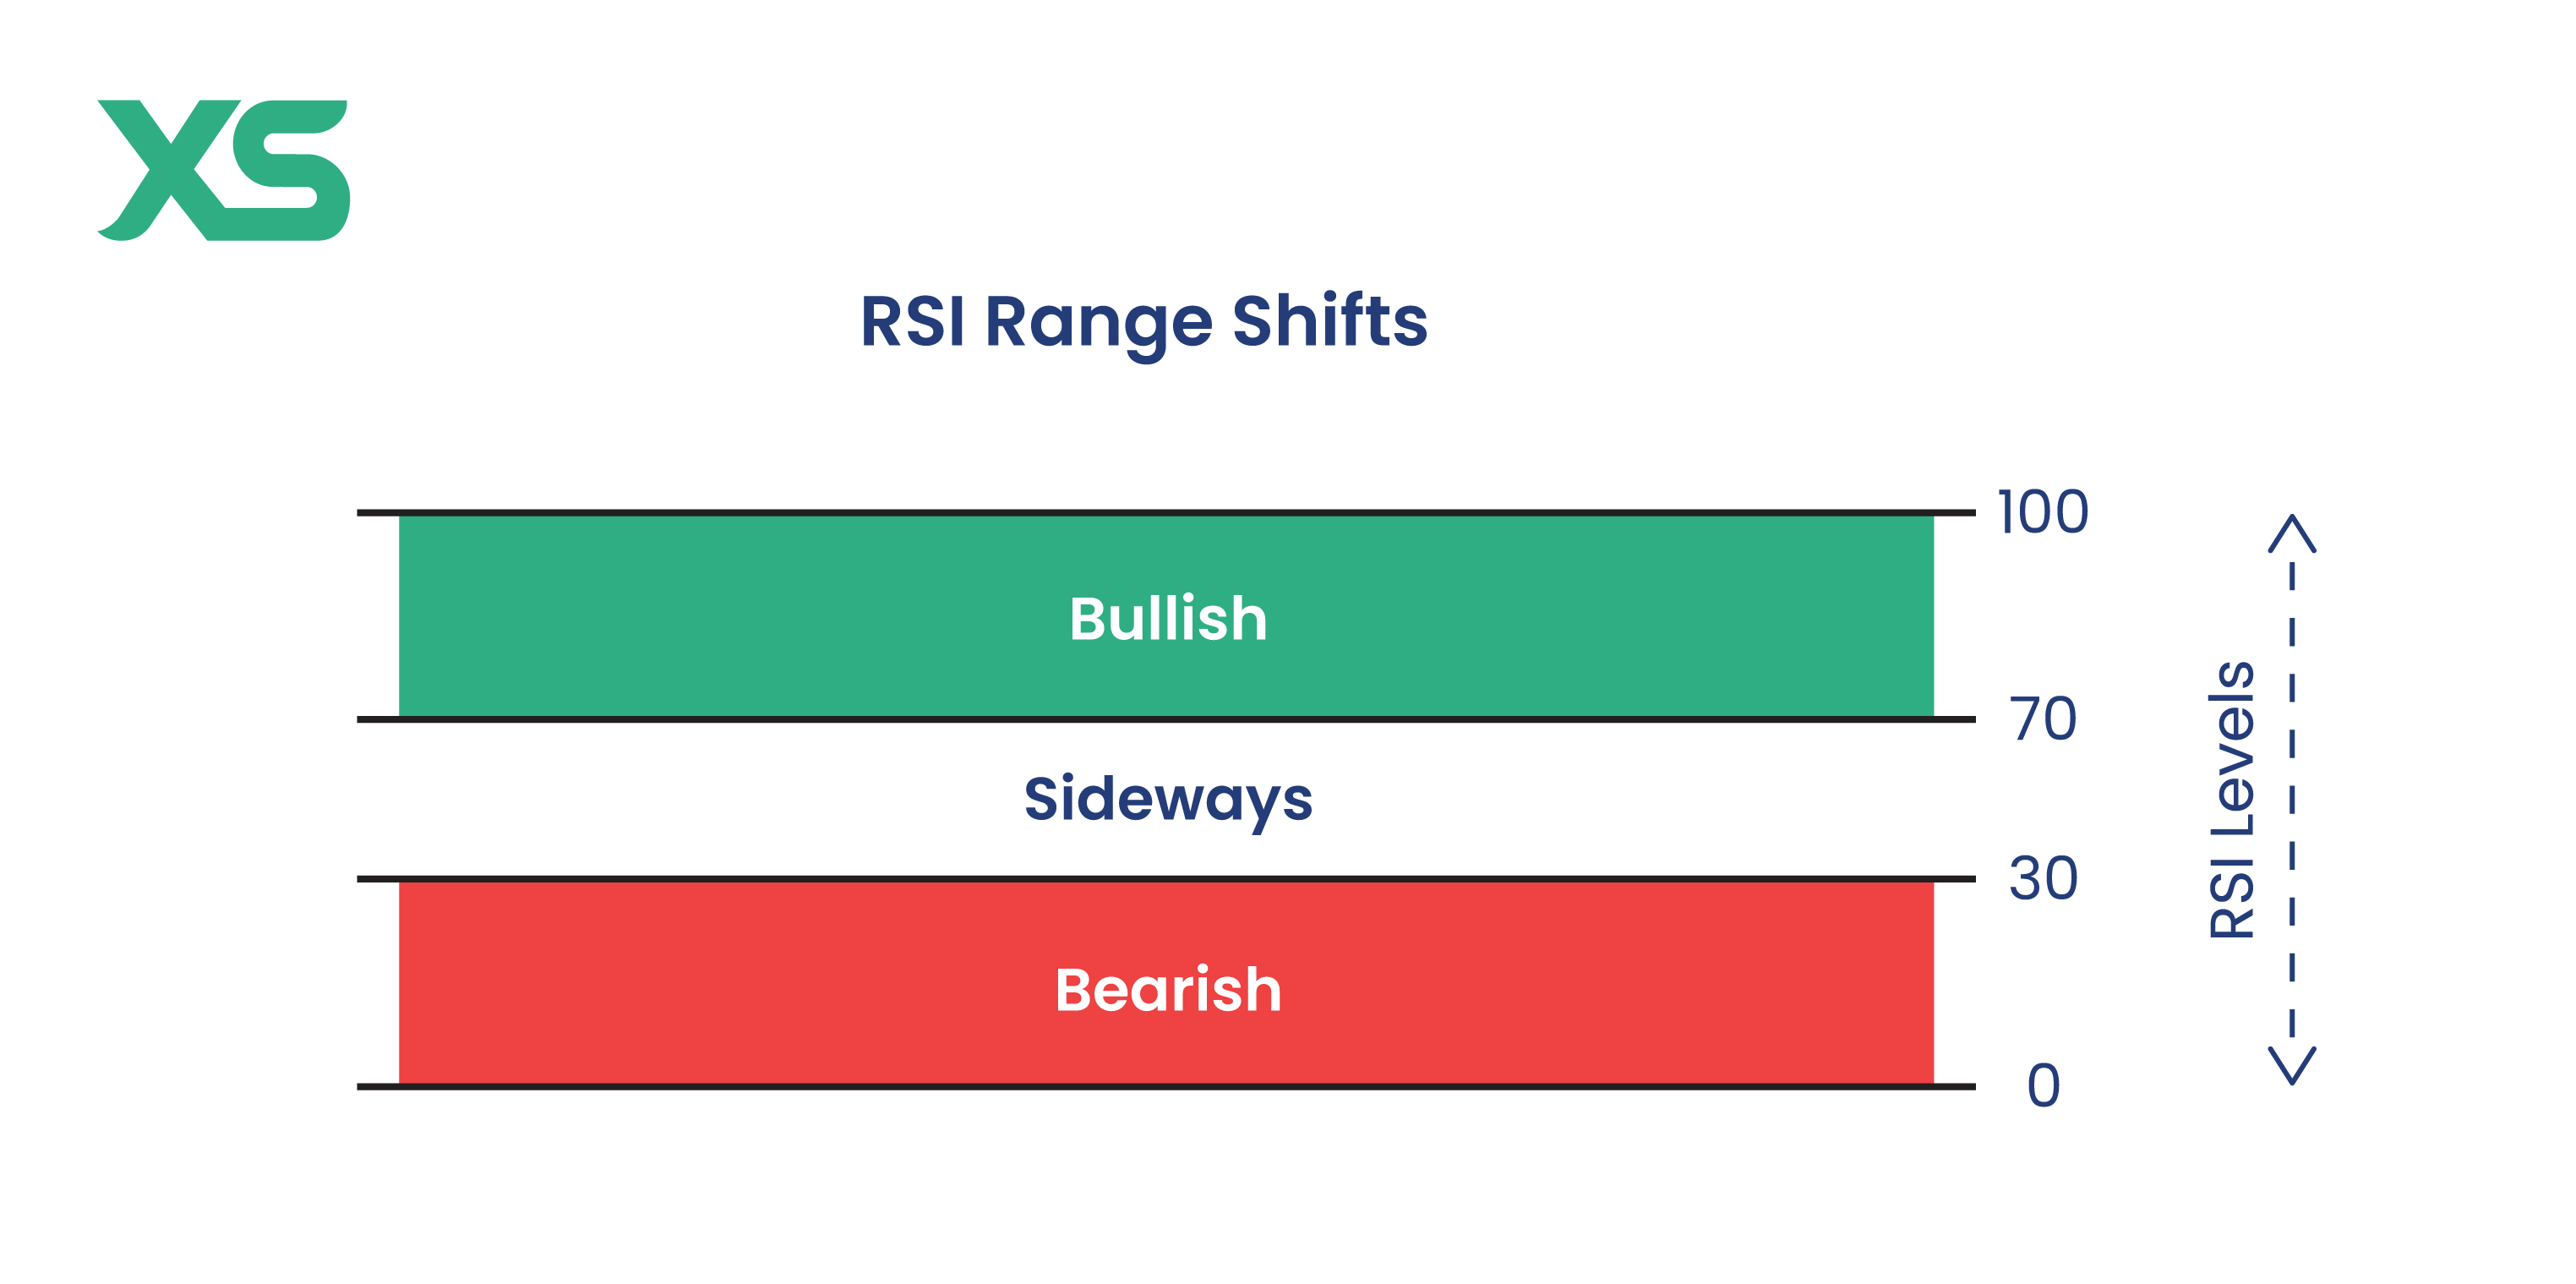
For example, if the price approaches resistance and RSI shows overbought conditions, this confluence signals a potential short trade. Similarly, near support, if RSI shows oversold, it could signal a buying opportunity.
By focusing on confluence in range-bound markets, traders can effectively capture smaller price moves with confidence.
Confluence in Trending Markets
In strong trending markets, whether bullish or bearish, confluence can be used to confirm entries in the direction of the prevailing trend.
For example, during an uptrend, traders might look for price retracements that align with a Fibonacci level and a bullish candlestick pattern, like the bullish engulfing, to confirm an entry point.
Confluence helps traders avoid entering trades based on false signals and ensures their trades align with the market’s broader momentum.
Confluence in Low-Volume Markets
In low-volume or illiquid markets, price movements can be harder to predict. This makes it even more important to rely on confluence to confirm trade setups.
Low-volume markets often see random price spikes or drops, so traders can combine tools like moving averages and support/resistance levels with volume indicators.
This ensures that there is enough market participation behind the price action, reducing the chance of entering a trade during a false move.
Key Components of Confluence in Trading
To successfully use confluence in trading, it's important to understand the key components that make it work. Here are some of the most crucial elements.
1. Indicator Signals
Technical indicators like moving averages, RSI (Relative Strength Index), and MACD (Moving Average Convergence Divergence) are essential tools for generating trade signals.
Moving averages help in identifying the direction of the trend, while RSI indicates whether an asset is overbought or oversold, which signals possible reversals.
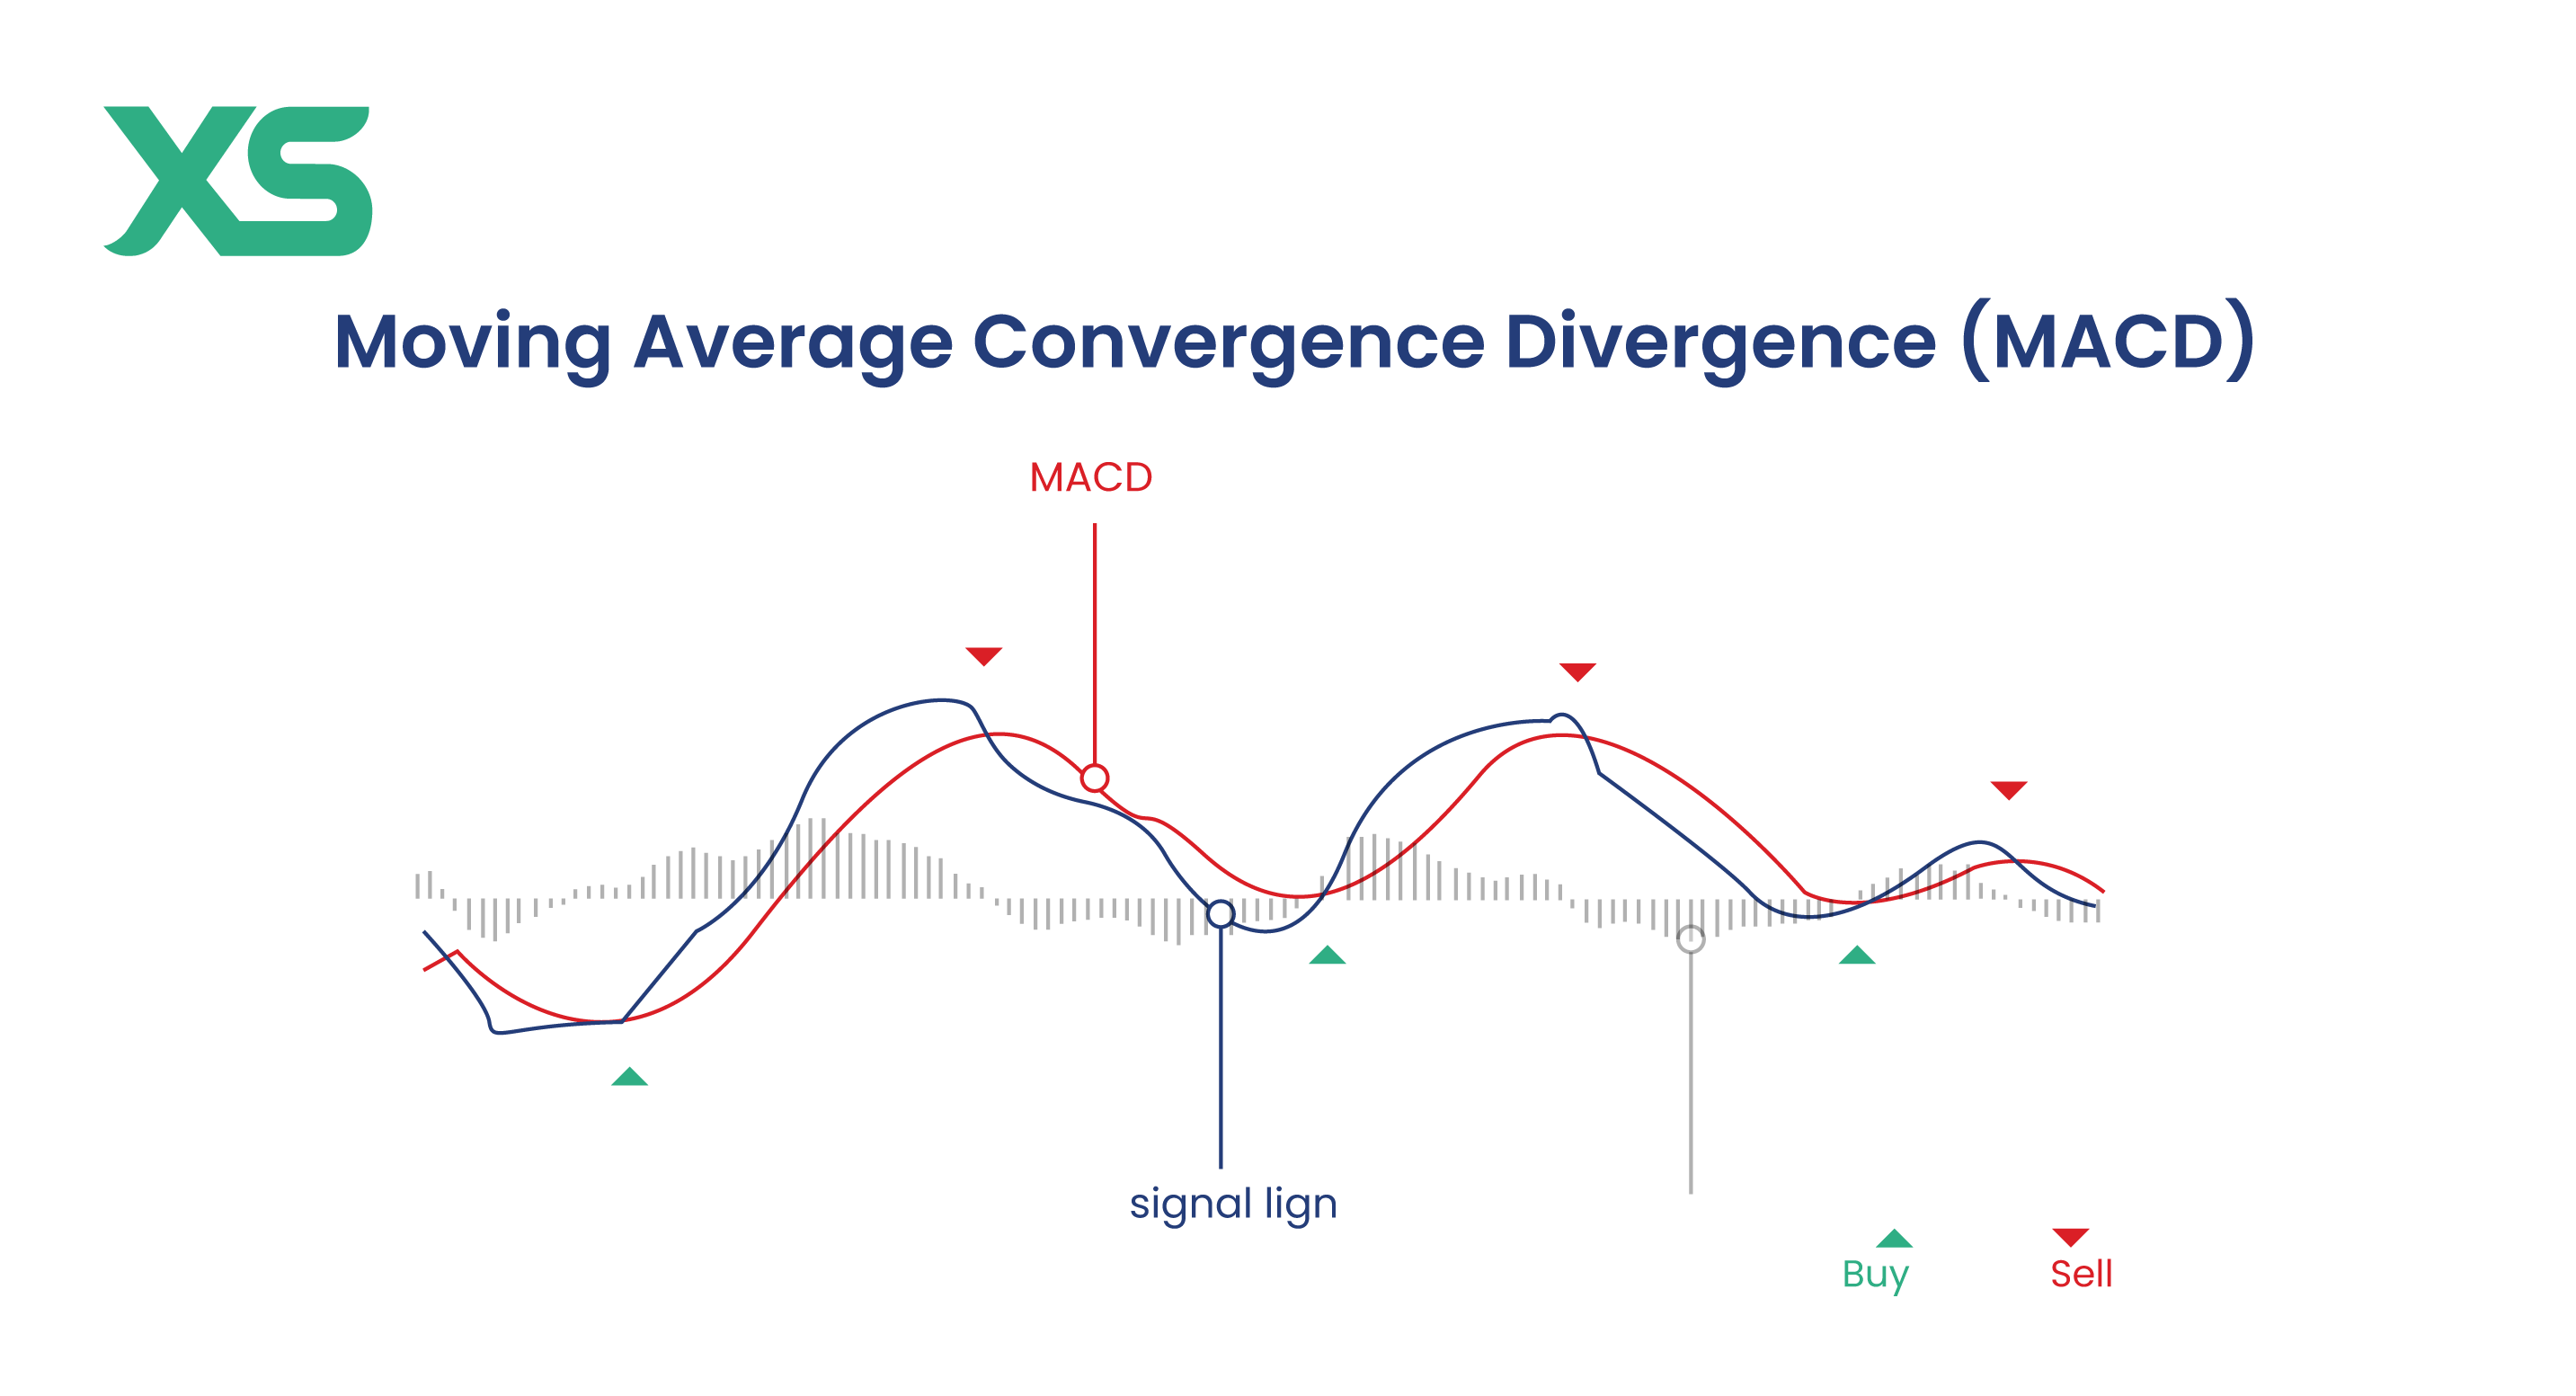
MACD is used for momentum and trend direction confirmation. When these indicators align, they create a stronger signal than when used individually.
For example, if both the moving average and RSI indicate a bullish trend, this confluence suggests a higher probability of success for a long trade.
Combining indicators for confluence is one of the most effective ways to increase trade accuracy.
2. Chart and Candlestick Patterns
Candlestick patterns, such as engulfing patterns, hammers, and shooting stars, provide insights into market sentiment.
These patterns show how buyers and sellers are interacting at key price levels. So, when they align with technical indicators or key levels like support and resistance, they contribute significantly to confluence.
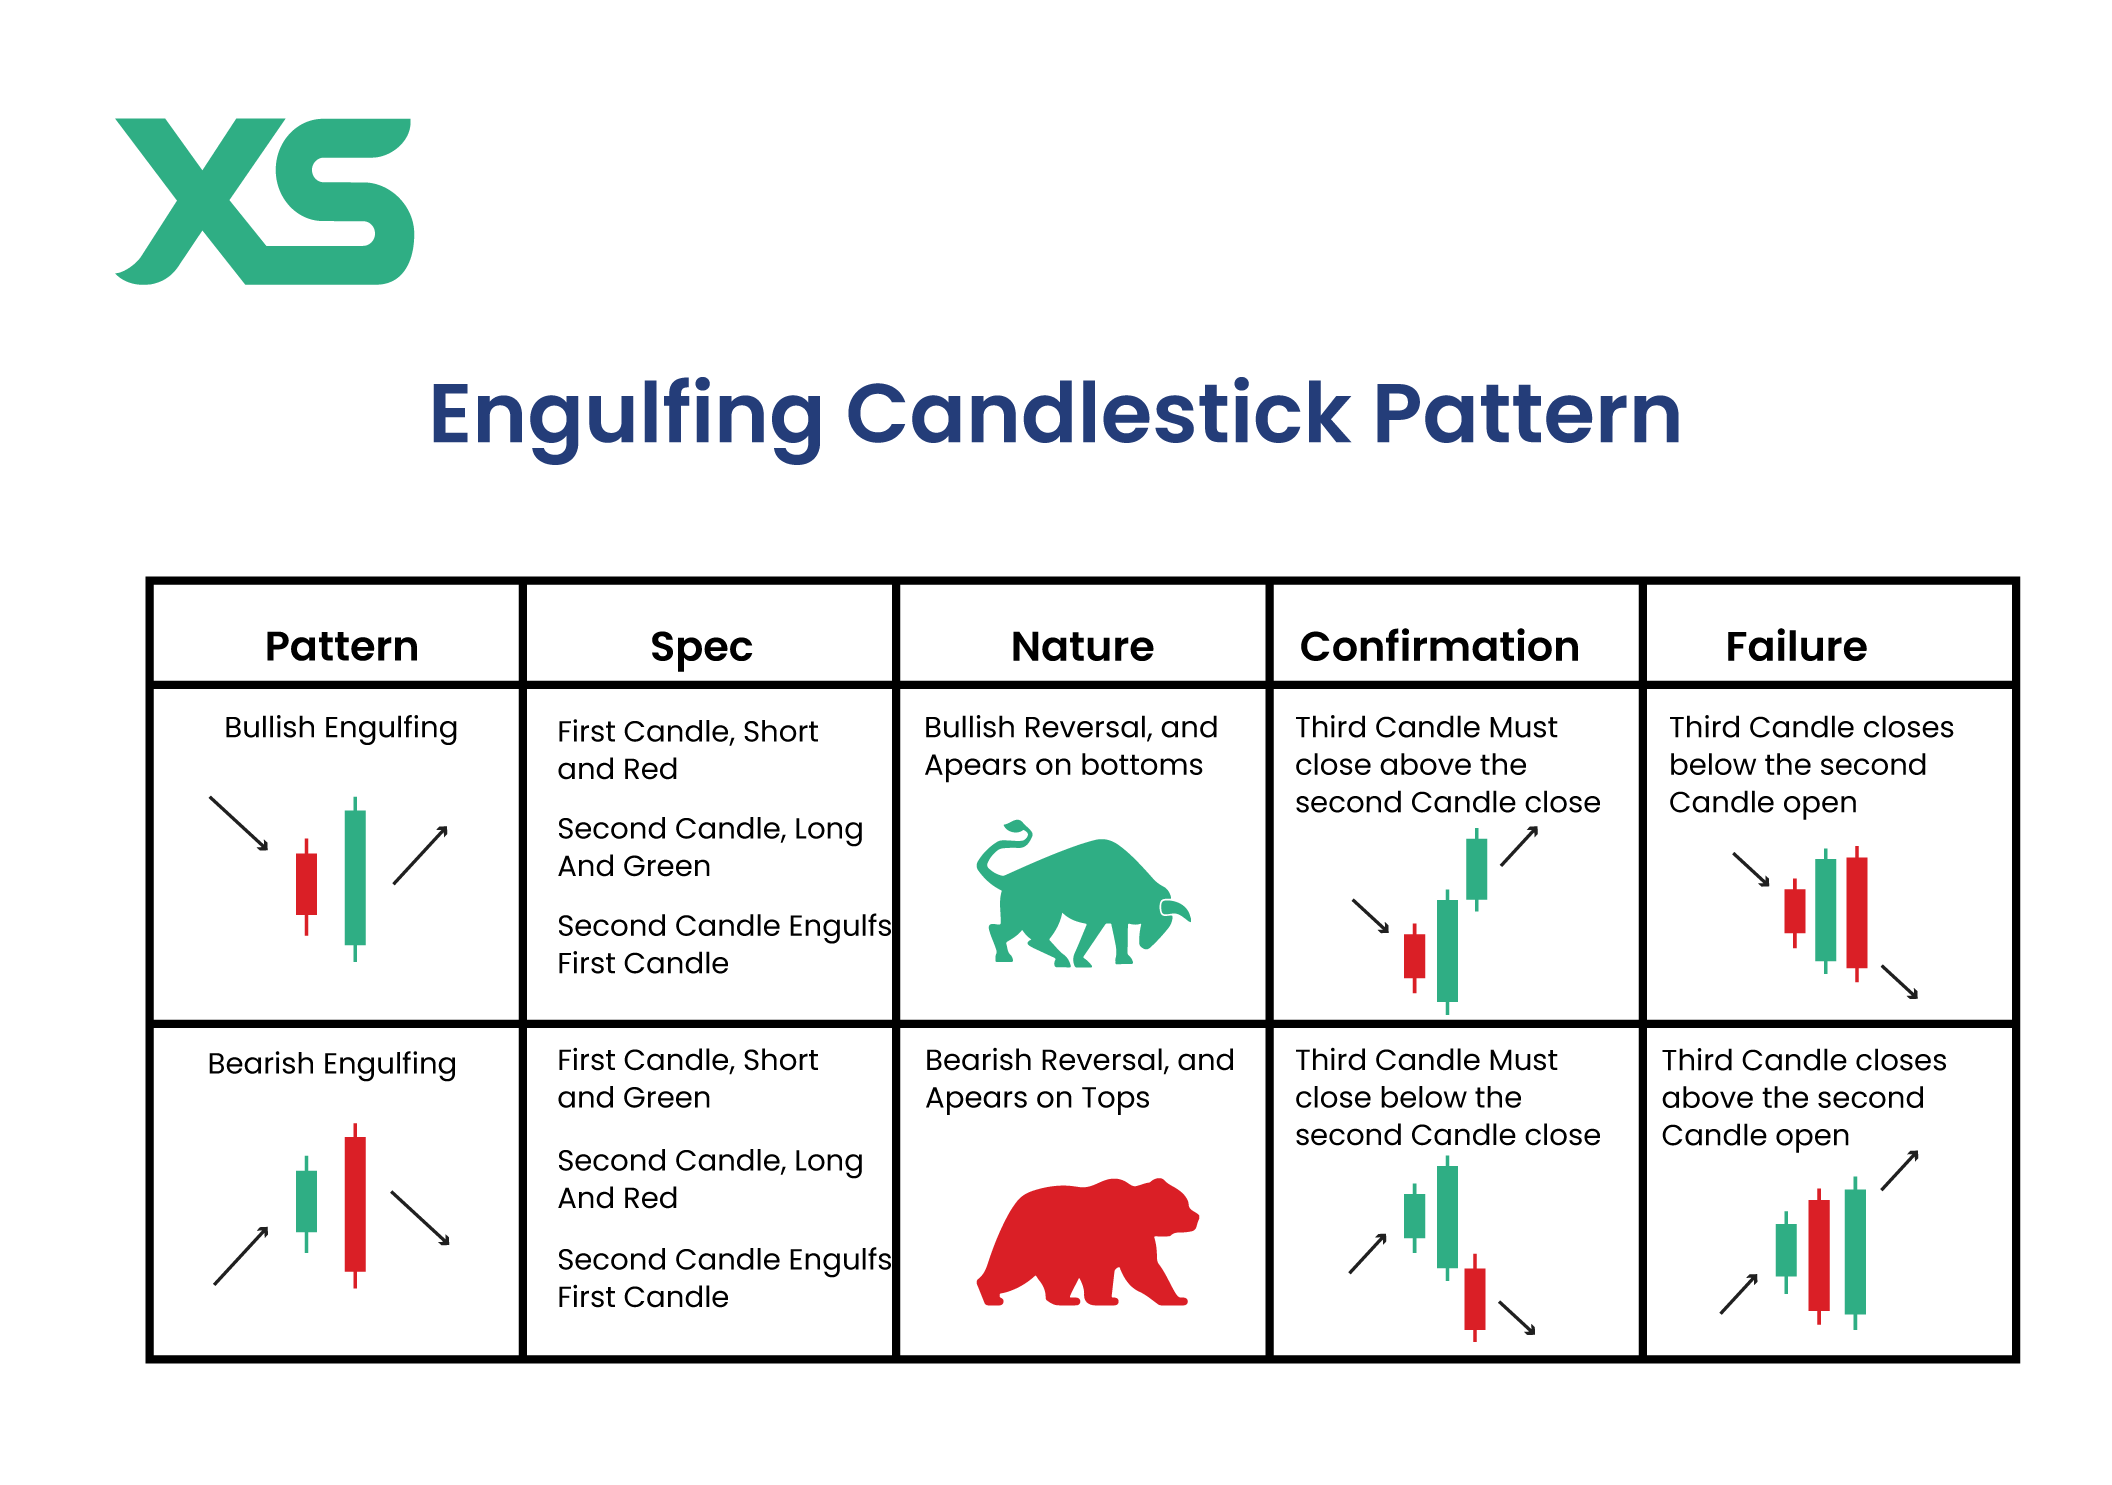
For instance, if a bullish engulfing candlestick forms at a support level while an RSI indicates oversold conditions, the confluence of these signals suggests a potential upward reversal, making it a more confident trade setup.
3. Support and Resistance Levels
Support and resistance levels are fundamental to technical analysis.
-
Support represents a price level where demand is strong enough to prevent the price from falling further.
-
Resistance is a level where selling pressure prevents the price from rising.
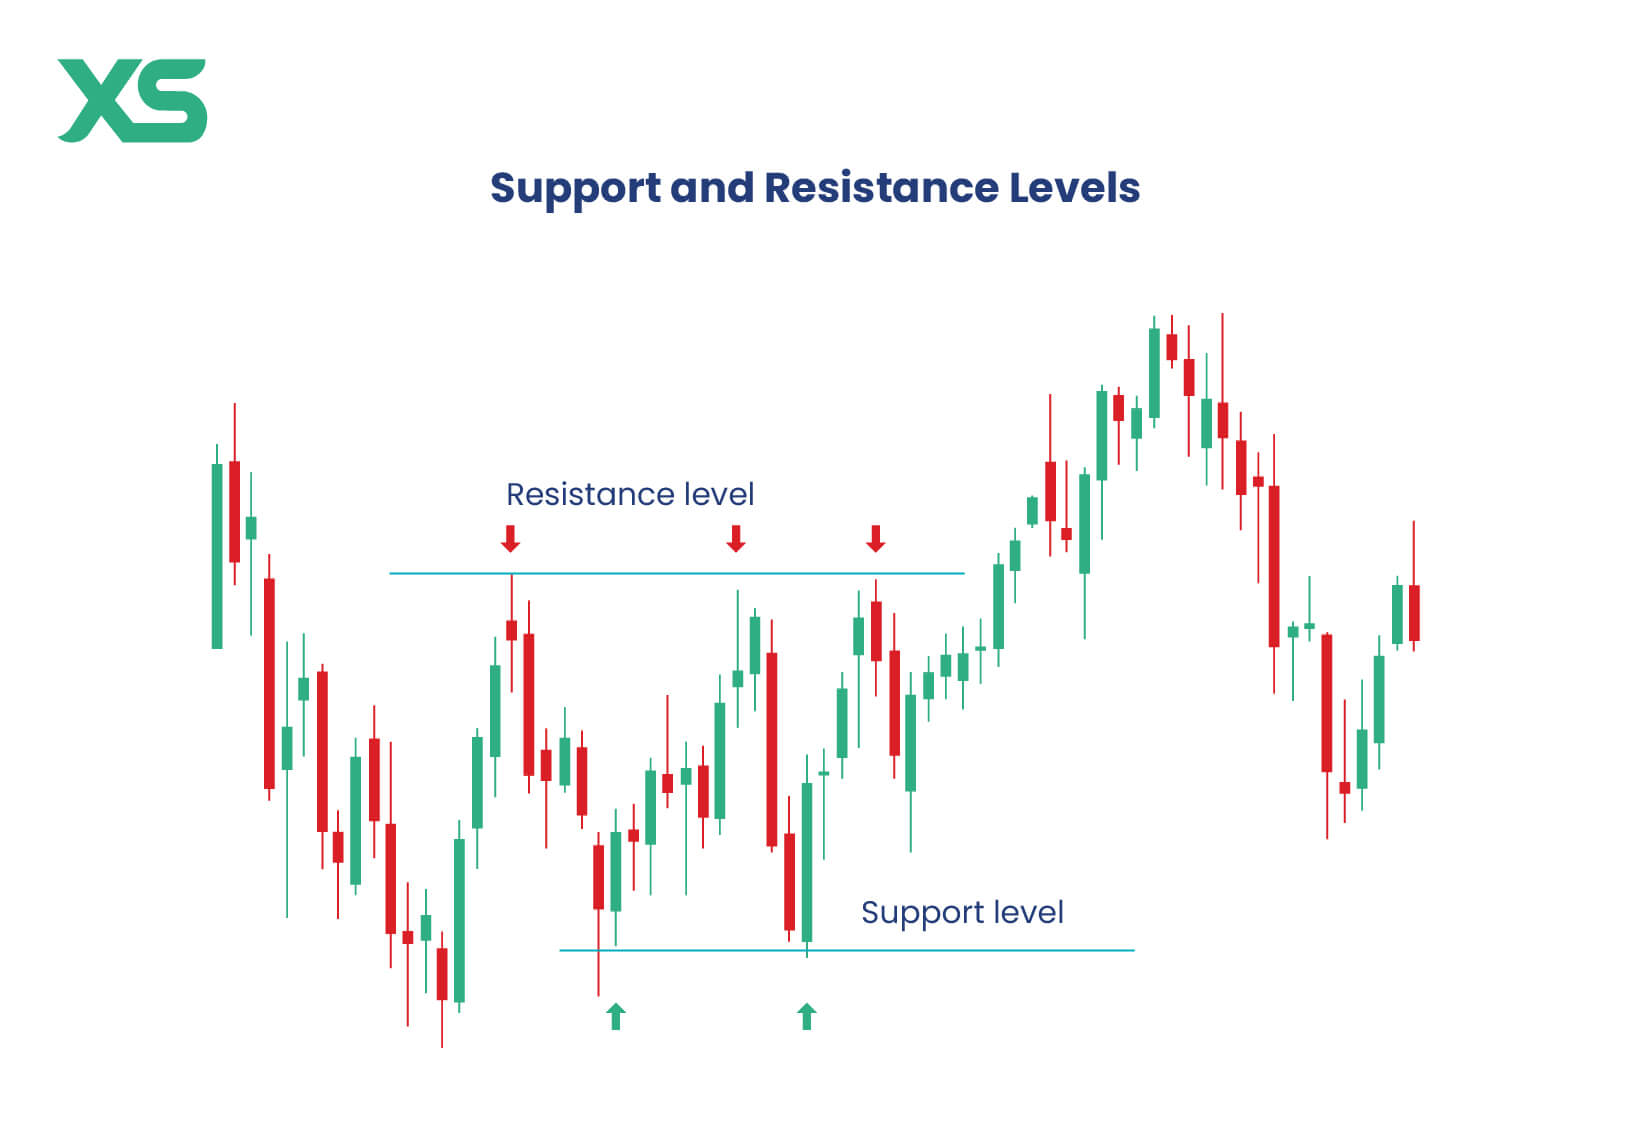
These levels are even more powerful when combined with other tools like moving averages or Fibonacci retracement levels.
For example, if the price hits a strong resistance level and coincides with a bearish candlestick pattern and an overbought RSI reading, this confluence strongly signals a potential price drop.
4. Trend Analysis
Trend analysis is critical for aligning your trades with the broader market movement. Identifying whether the market is trending up, down, or sideways allows traders to align their strategies accordingly.
When combined with other signals, such as moving average crossovers or chart patterns, trend analysis becomes even more effective.
For instance, if the market is in a clear uptrend and price retraces to a trendline while forming a bullish candlestick pattern, this confluence can confirm the continuation of the trend.
5. Higher Time frame Analysis
Analyzing higher time frames offers a broader perspective on market direction and helps validate trade setups on lower time frames.
A confluence of signals on a higher timeframe (like a daily or weekly chart) can provide extra confirmation for trades on smaller time frames (like the 1-hour or 15-minute chart).
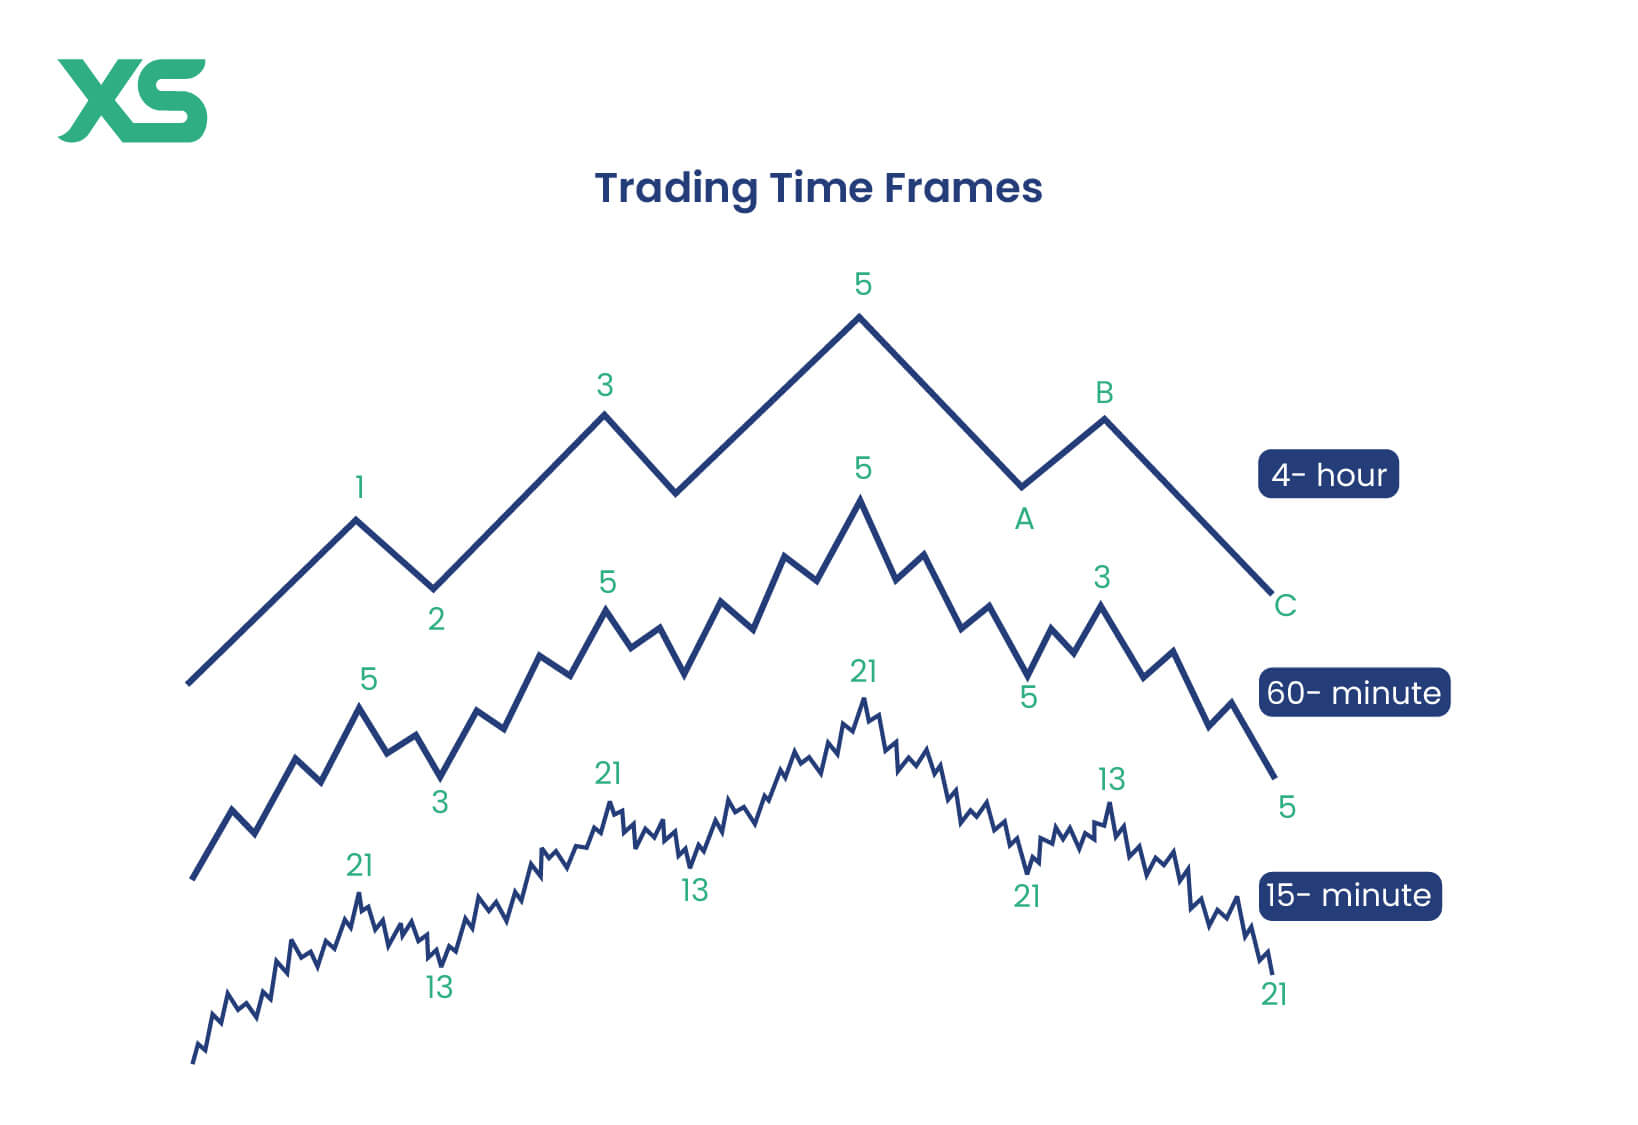
For example, if a key support level on the daily chart aligns with a bullish signal on the 1-hour chart, this confluence suggests a more reliable trade setup.
6. Correlation Between Multiple Markets
Observing correlations between different markets can provide additional confirmation in confluence trading.
For instance, certain markets like commodities, indices, or currency pairs often move in tandem. If you're trading gold, for example, it’s useful to monitor the movement of related markets like the U.S. dollar.
A confluence between bullish signals in both gold and a weakening dollar strengthens the confidence in a long trade on gold, as these markets are inversely correlated.
7. Fundamental Analysis
Fundamental analysis is an important part of confluence trading. While technical analysis focuses on price patterns and indicators, fundamental analysis looks at the underlying factors driving the market, such as economic data releases, geopolitical events, or central bank policies.
For example, if a central bank announces a rate cut, and this aligns with a bullish technical setup in the forex market, this confluence of technical and fundamental factors strengthens the probability of a successful trade.
Traders often find the most reliable setups when their technical indicators align with supportive fundamental events.
8. Time of Day and Market Sessions
The time of day and the market session you're trading in can greatly influence the success of your trades.
Different trading sessions, Asian, European, and U.S., have varying levels of market activity, liquidity, and volatility. Confluence trading can be more effective when aligned with active market sessions.
For example, if a confluence of signals appears during the opening of the London or New York session, when volume and liquidity are high, the probability of the trade playing out as expected increases. This is because these sessions often drive significant market movements compared to quieter periods.
How to Use Confluence in Trading: Step-by-Step
Confluence trading involves combining multiple signals to make better-informed trading decisions.
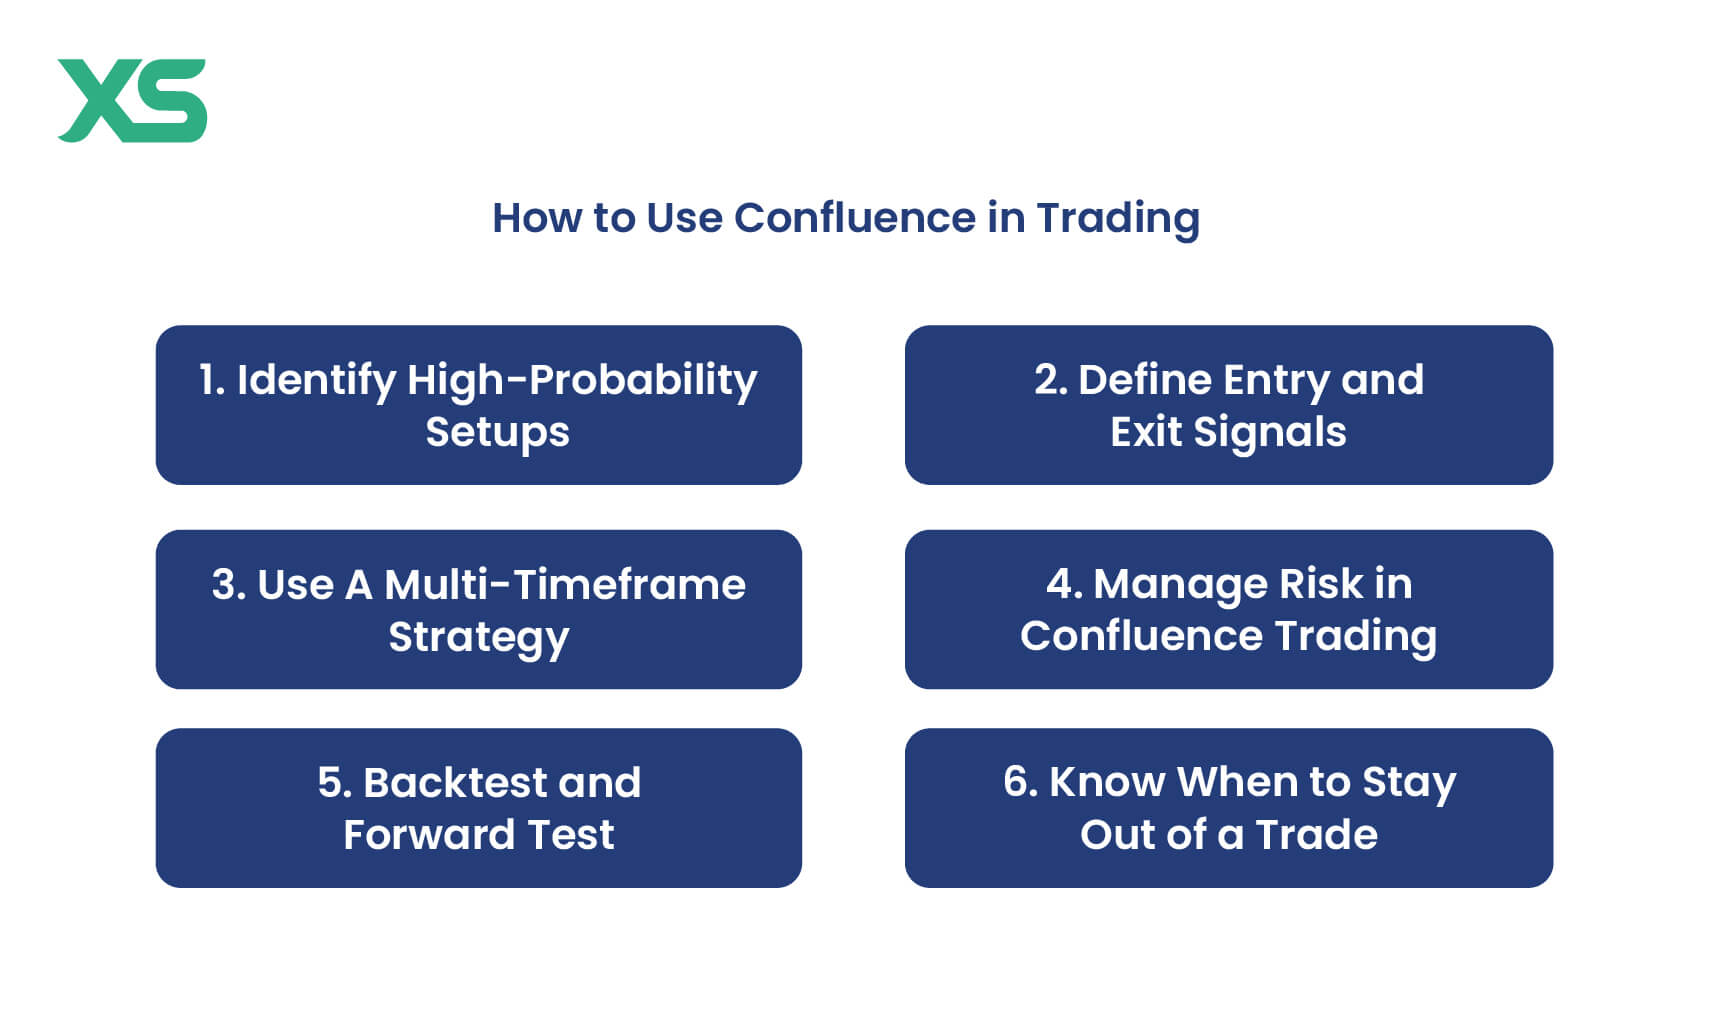
Below is a step-by-step guide to effectively using confluence in your strategy.
-
Identify High-Probability Setups
-
Define Entry and Exit Signals
-
Use A Multi-Timeframe Strategy
-
Manage Risk in Confluence Trading
-
Backtest and Forward Test
-
Know When to Stay Out of a Trade
1. Identifying High-Probability Setups
Begin by spotting setups where multiple factors align, as explained above. For example, if the price touches a strong support level, forms a bullish candlestick pattern, and the RSI shows oversold conditions, these combined signals indicate a high-probability trade. The more signals that converge, the stronger the setup.
2. Defining Entry and Exit Signals
Precise entry and exit signals are crucial for confluence trading.
-
Entry Signals: A typical entry might occur when price reaches a support zone, a bullish candlestick forms, and the RSI crosses out of oversold.
-
Exit Signals: Exits should also be defined by a convergence of signals, such as hitting a resistance level, a bearish divergence on the MACD, or an overbought RSI reading.
3. Multi-Timeframe Confluence
Using a multi-timeframe strategy is key to improving the accuracy of confluence trading.
Analyze higher timeframes, like the daily or 4-hour charts, to confirm the overall trend, then zoom into smaller timeframes (such as the 1-hour or 15-minute charts) for precise entry points.
If the signals align across timeframes, it adds weight to your setup, helping you avoid counter-trend trades.
4. Managing Risk in Confluence Trading
Even with strong confluence, no trade is guaranteed. Proper risk management is essential to long-term success.
-
Position Sizing: Limit your risk to a small percentage of your trading capital, typically 1-2% per trade.
-
Stop-Loss Orders: Place stop-losses just beyond key levels, like a support or resistance zone, to protect against unexpected moves.
Confluence trading helps pinpoint more accurate stop-loss and take-profit levels, reducing unnecessary risk.
5. Backtesting and Forward Testing
Before using your confluence strategy in live markets, backtest it on historical data to see how it performs over time. This helps you identify any weaknesses or areas for improvement.
Once backtested, forward test in real-time market conditions to ensure the strategy works effectively under current conditions. This process fine-tunes your approach, making it more reliable.
6. When to Stay Out of a Trade
Discipline is key in confluence trading, and knowing when not to trade is just as important as knowing when to enter. Avoid trades where clear confluence is lacking, even if you’re eager to enter the market.
Overtrading without sufficient confirmation can lead to unnecessary losses. Only take trades where multiple signals align, ensuring higher confidence in the trade.
Benefits of Using Confluence in Trading
Confluence in trading offers several key advantages:
-
Multiple signals help filter out false setups.
-
Trades are more likely to succeed when confirmed by several indicators.
-
Clearer entry and exit points enhance risk control.
-
Aligning multiple factors boosts confidence in trade decisions.
-
Works across various markets and timeframes.
-
Focuses on high-quality setups, preventing unnecessary trades.
Common Mistakes to Avoid When Using Confluence Strategy
However, to get the most out of confluence trading, avoid these common mistakes:
-
Using too many can cause confusion. Keep it simple.
-
Always consider the broader market conditions.
-
Don’t trade unless strong confluence exists.
-
Always use stop-losses and manage risk properly.
-
Only trade when quality signals align.
-
Backtest and forward test your strategy before using it live.
Conclusion
Confluence trading allows you to increase your chances of success by aligning multiple indicators and tools to confirm your trades.
By focusing on high-probability setups, managing risk effectively, and avoiding common mistakes, you can trade with more confidence and consistency across different markets.

Get the latest insights & exclusive offers delivered straight to your inbox.
Table of Contents
FAQs
An example would be a bullish engulfing candlestick pattern forming at a key support level, while RSI shows oversold conditions and the price is at a Fibonacci retracement level.
Factors include technical indicators, price action patterns, support and resistance levels, and fundamental analysis.
Confluence increases the accuracy of trades by confirming setups across multiple signals, helping traders avoid false signals.
Look for areas on the chart where multiple indicators, patterns, or key levels overlap. These are typically high-probability zones.
There is no single best indicator, but commonly used ones include moving averages, RSI, and Fibonacci retracement.
Yes, confluence trading can be applied to various markets, including forex, stocks, and cryptocurrencies.
This written/visual material is comprised of personal opinions and ideas and may not reflect those of the Company. The content should not be construed as containing any type of investment advice and/or a solicitation for any transactions. It does not imply an obligation to purchase investment services, nor does it guarantee or predict future performance. XS, its affiliates, agents, directors, officers or employees do not guarantee the accuracy, validity, timeliness or completeness of any information or data made available and assume no liability for any loss arising from any investment based on the same. Our platform may not offer all the products or services mentioned.


