Forex
21 Bullish Candlestick Patterns Traders Must Know in 2025
Written by Sarah Abbas
Updated 11 March 2025

Table of Contents
Bullish candlestick patterns can help traders spot potential market reversals and strong buying opportunities. These patterns appear on price charts and signal when buyers are gaining control, making them essential for technical analysis.
In this article, we’ll break down 21 bullish candlestick patterns every trader must know in 2025, explaining how they work and when to use them.
Key Takeaways
-
Bullish candlestick patterns signal potential price increases by showing when buyers are gaining control after a downtrend or consolidation.
-
Combining candlestick patterns with technical indicators like RSI, MACD, and moving averages improves accuracy and helps confirm trading signals.
-
Volume and support levels play a crucial role in validating bullish patterns, making them more reliable for identifying trend reversals or continuations.
Try a No-Risk Demo Account
Register for a free demo and refine your trading strategies.
Open Your Free Account
What Are Bullish Candlestick Patterns?
Bullish candlestick patterns are chart formations that signal a potential price increase, usually after a downtrend or a period of consolidation. They form when buyers step in and push prices higher, indicating that market sentiment is shifting in their favor.
These patterns can appear as single candlesticks or in combinations of two or more candles, each with unique characteristics that traders use to predict future movements.
Here are a few important factors to look for when identifying bullish candlestick patterns:
-
Candle Body and Wick: Bullish candles usually have a larger body with a closing price higher than the opening price. Long lower wicks often indicate strong buying pressure after a price drop.
-
Pattern Location: A bullish candlestick pattern is most effective when it forms at a support level or after a significant downtrend, suggesting a potential reversal.
-
Volume Confirmation: Higher trading volume during a bullish pattern strengthens its reliability, showing strong buying interest.
List of 21 Bullish Candlestick Patterns in 2025
Here is the list of top 21 bullish candlestick patterns in 2025:
-
Bullish Marubozu
-
Hammer
-
Inverted Hammer
-
Dragonfly Doji
-
Bullish Engulfing
-
Piercing Line
-
Tweezer Bottoms
-
Bullish Harami
-
Inside Bar (Bullish)
-
Bullish Counterattack
-
Morning Star
-
Three White Soldiers
-
Bullish Abandoned Baby
-
Rising Three Methods
-
Three Inside Up
-
Bullish Kicker
-
Bullish Breakaway
-
On-Neck Pattern
-
Bullish Mat Hold
-
Island Reversal (Bullish)
-
Bullish Belt Hold
Single Candlestick Patterns
Single candlestick patterns are the simplest form of bullish signals, appearing as a single candle that suggests a potential price increase. While they can indicate trend reversals or continuations, they are more reliable when confirmed by volume or support levels.
Bullish Marubozu
The Bullish Marubozu is a strong signal of buying pressure, as it has no wicks, meaning the price opened at its lowest and closed at its highest. This indicates that buyers controlled the market throughout the session, often leading to further upward movement. It is a powerful continuation signal in an uptrend and a strong reversal indicator in a downtrend.
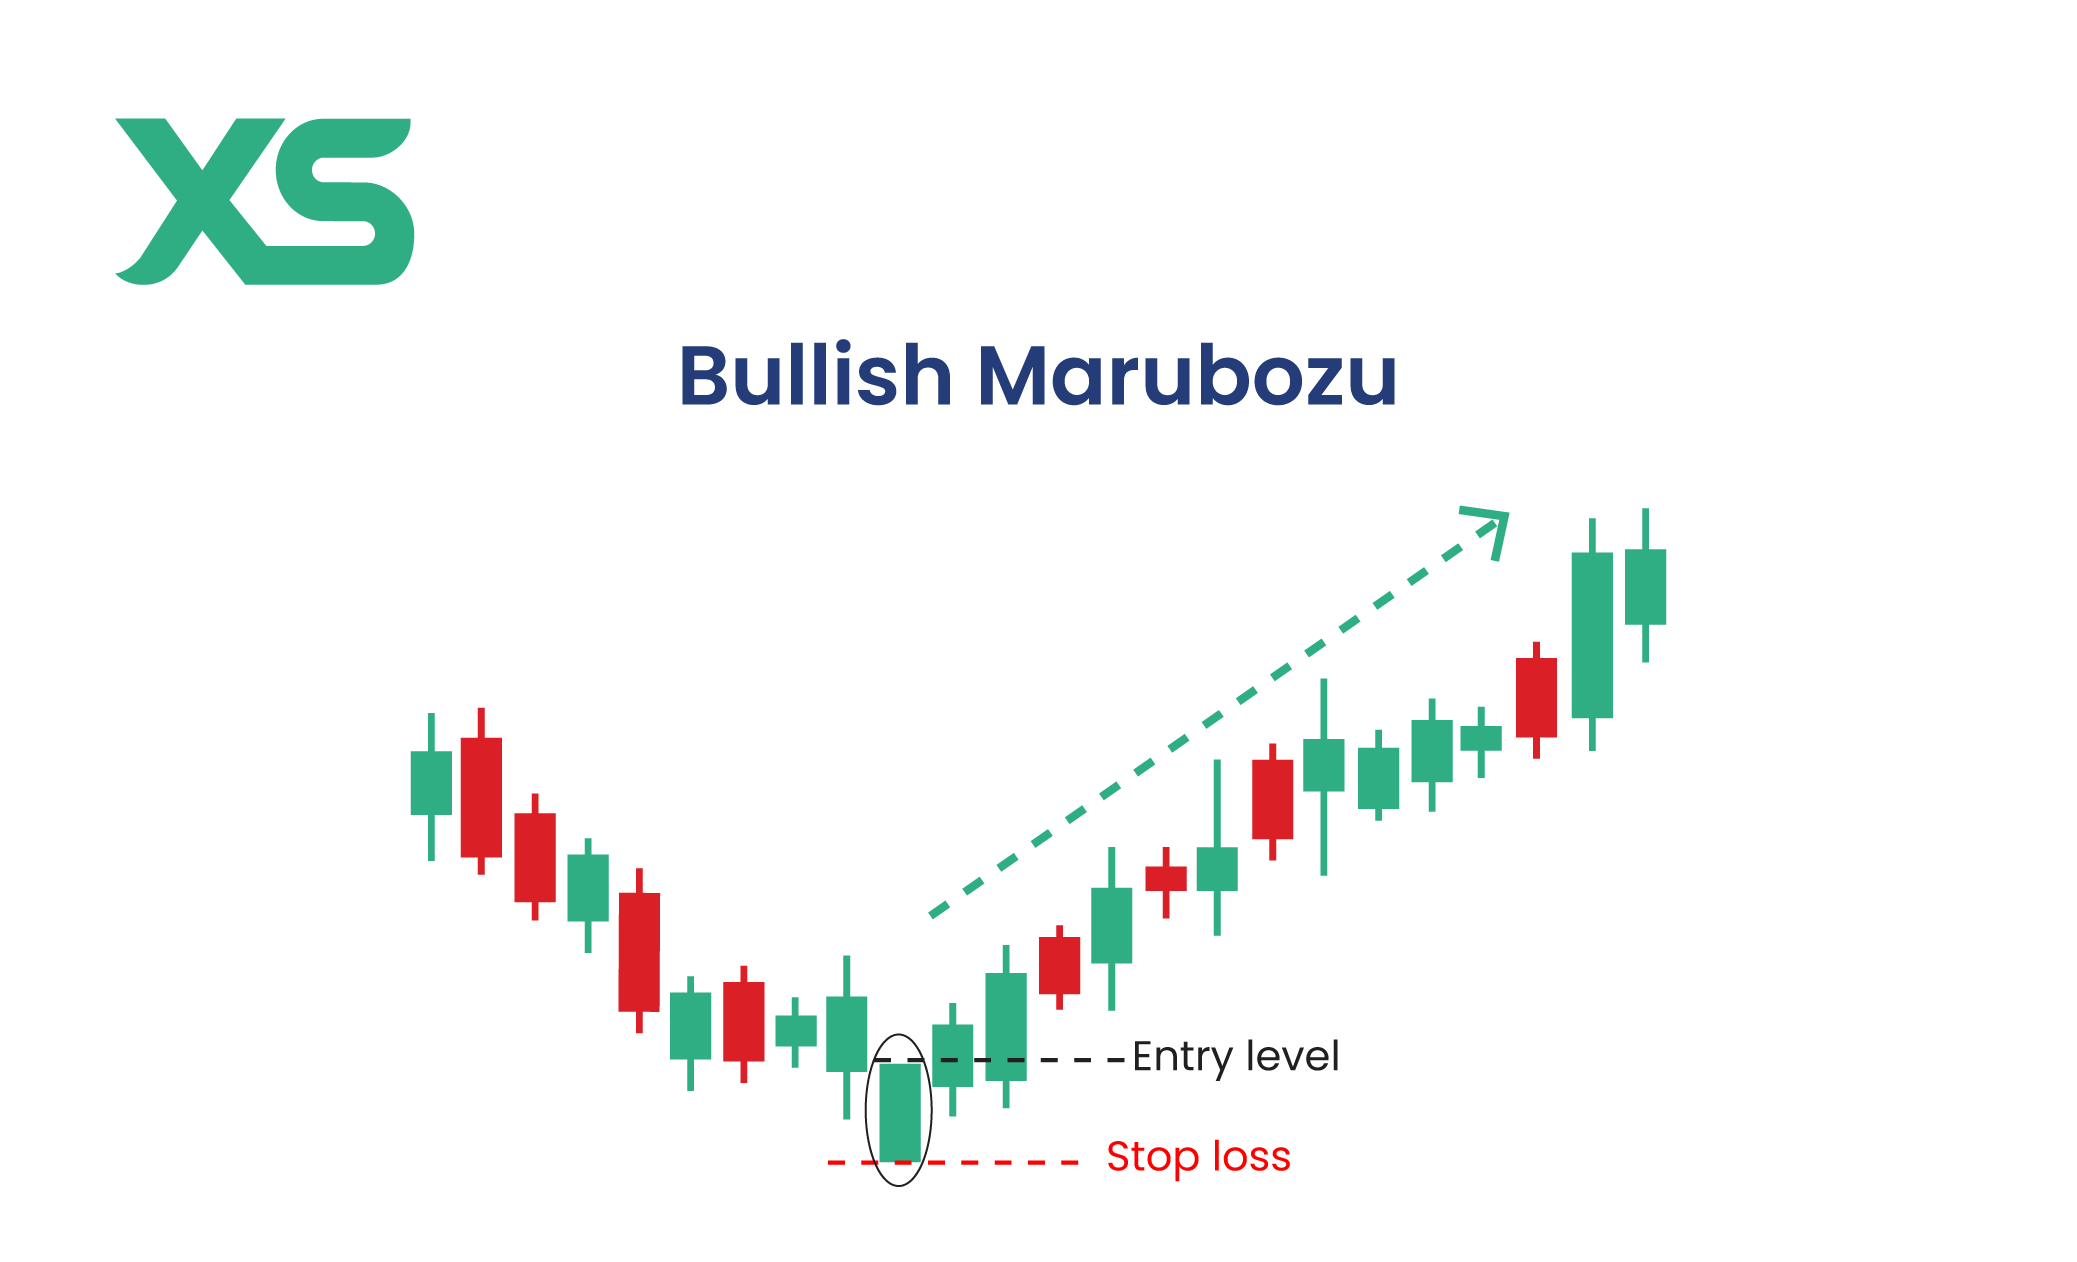
Key Features:
-
No upper or lower wicks, showing strong buyer control.
-
Signals continuation in an uptrend or reversal in a downtrend.
-
More reliable when confirmed by high trading volume.
Hammer
The Hammer appears after a downtrend and signals a potential reversal. It has a small body and a long lower wick, indicating that sellers pushed the price down before buyers regained control and drove it back up. The longer the lower wick, the stronger the reversal signal.
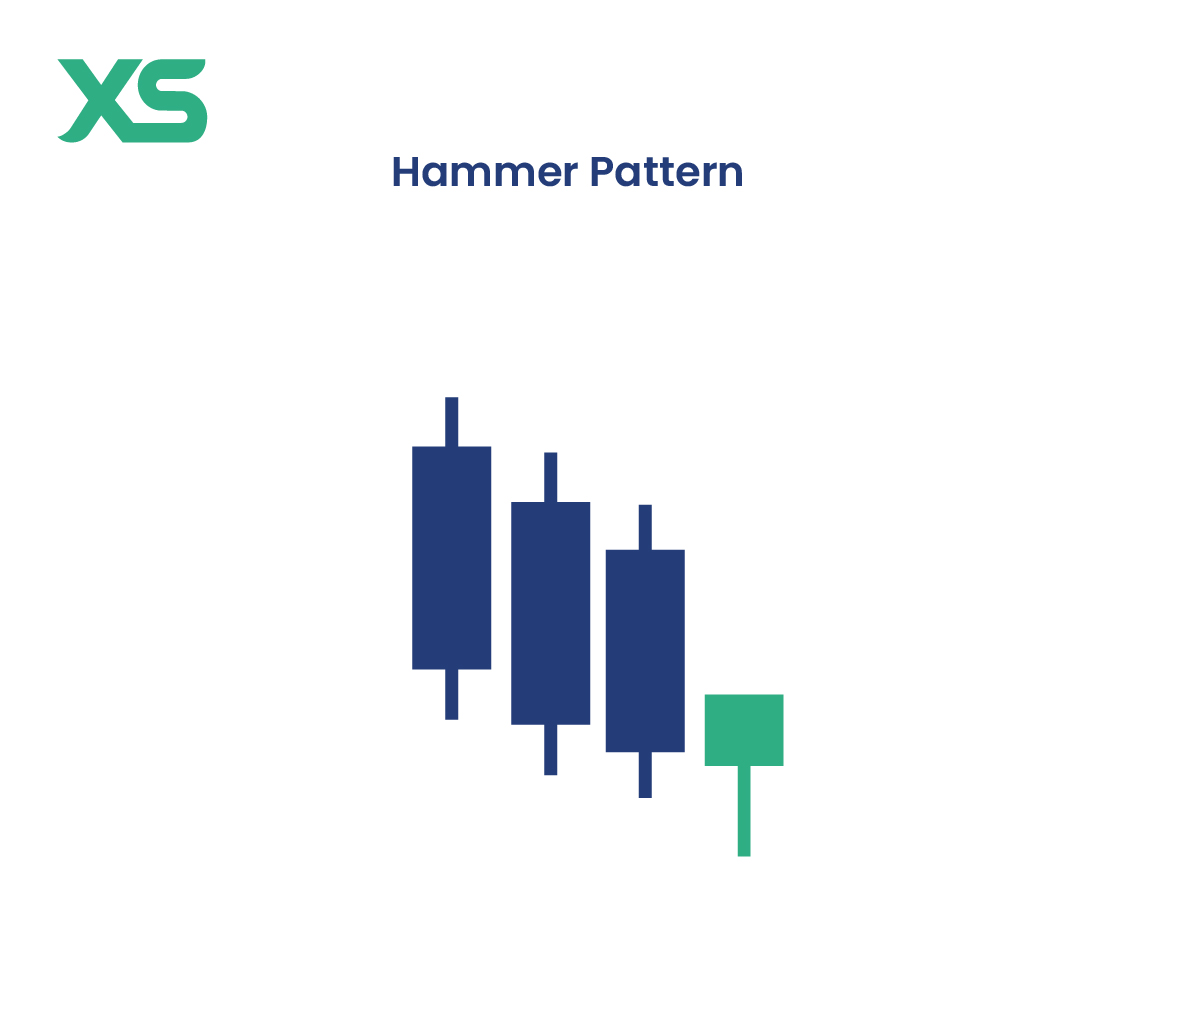
Key Features:
-
Small body with a long lower wick (at least twice the body size).
-
Appears after a downtrend, signaling a potential bullish reversal.
-
Requires confirmation from the next candle closing higher.
Inverted Hammer
The Inverted Hammer is a bullish candlestick pattern that forms at the end of a downtrend and looks similar to a regular hammer, except it has a long upper wick instead of a lower wick. This shows that buyers attempted to push prices higher but faced resistance. However, if the next candle is bullish, it confirms the reversal.
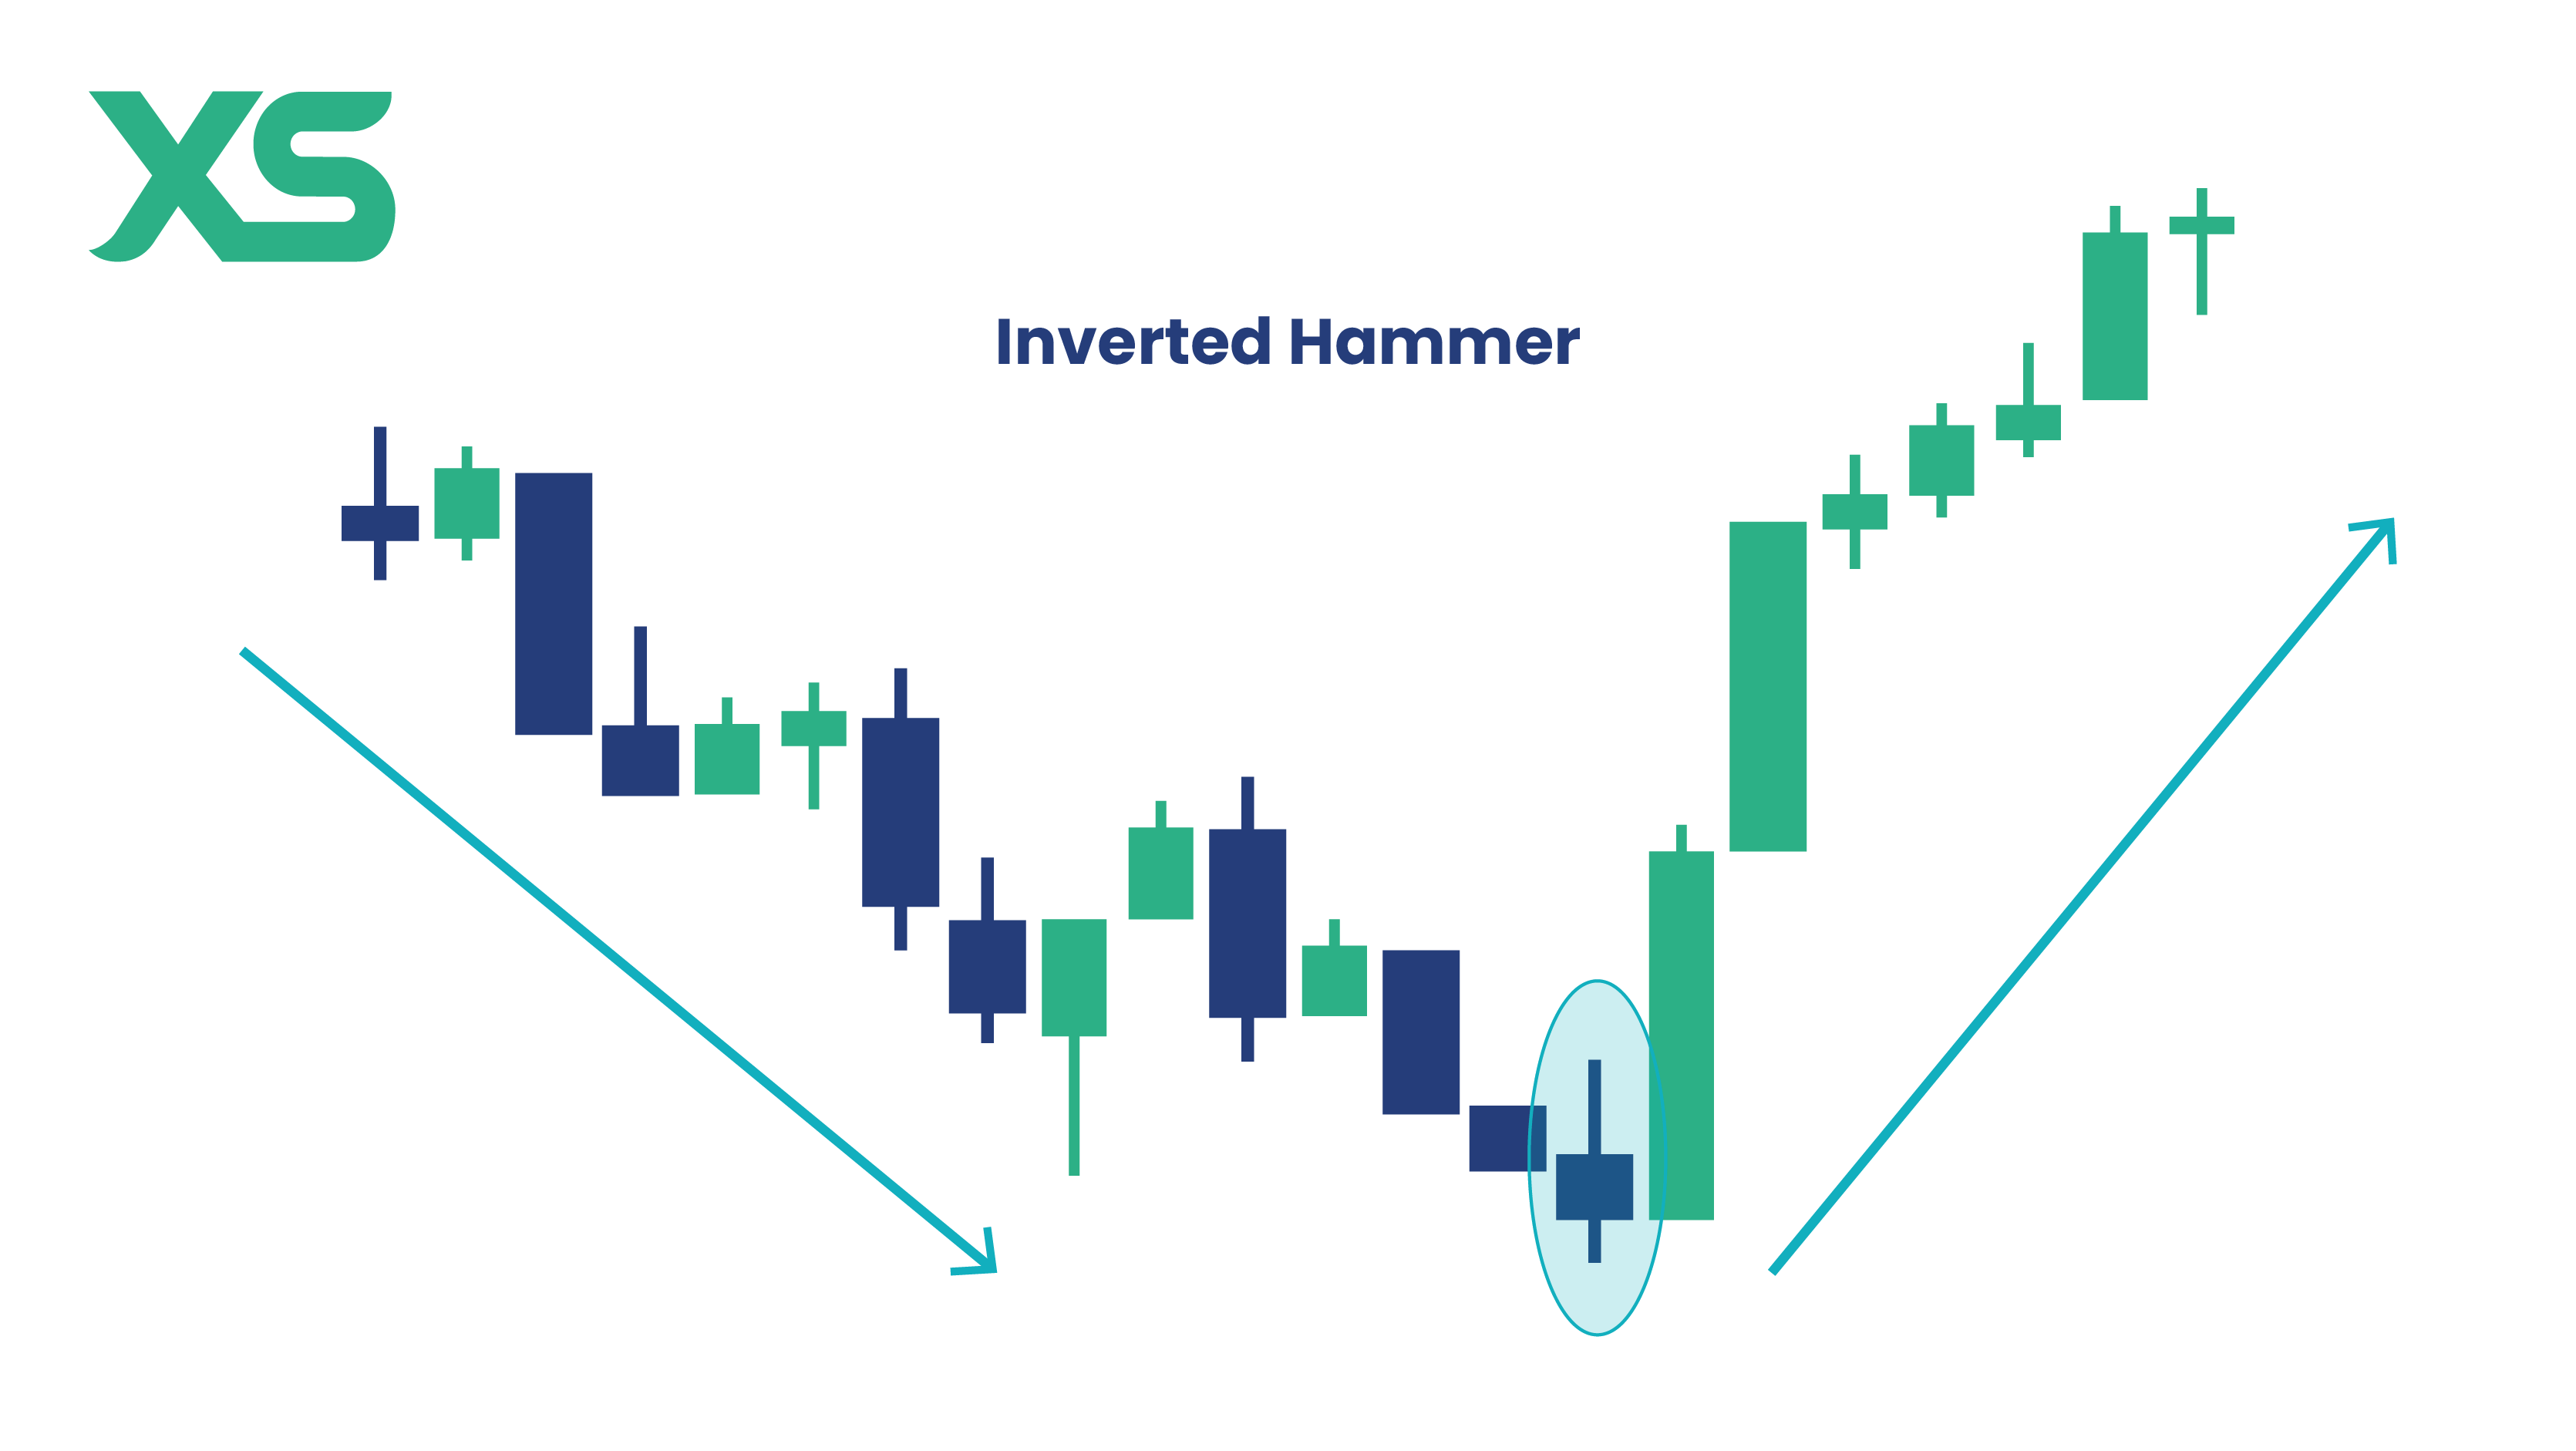
Key Features:
-
Small body with a long upper wick and little to no lower wick.
-
Appears after a downtrend, signaling potential reversal.
-
Needs confirmation from a bullish close in the next session.
Dragonfly Doji
A Dragonfly Doji has a long lower wick and little to no body, meaning the open, close, and high prices are nearly the same. This indicates that sellers initially drove the price lower, but buyers pushed it back up to the opening level. When found at the bottom of a downtrend, it suggests a potential bullish reversal.
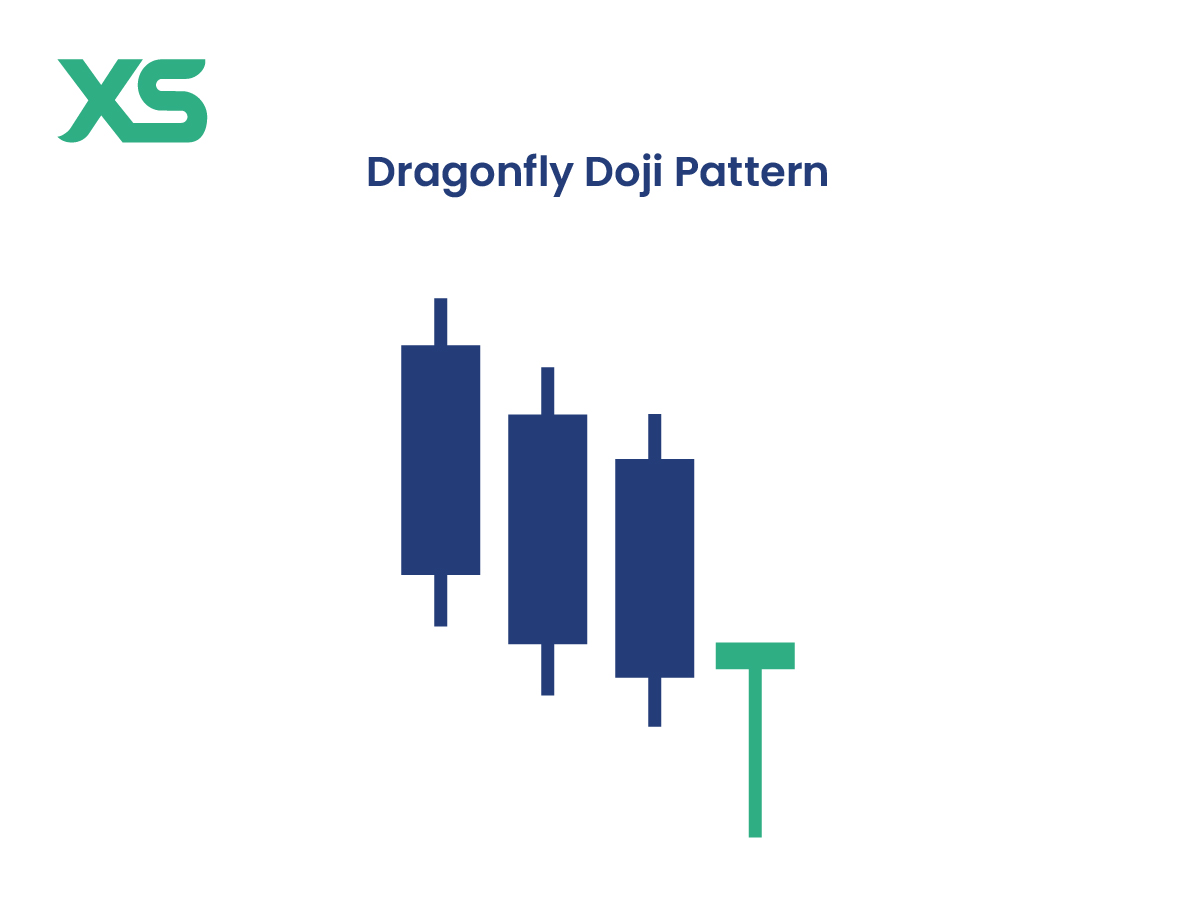
Key Features:
-
Open, close, and high are almost identical, with a long lower wick.
-
Suggests a shift from selling pressure to buying strength.
-
Confirmation from the next bullish candle strengthens the signal.
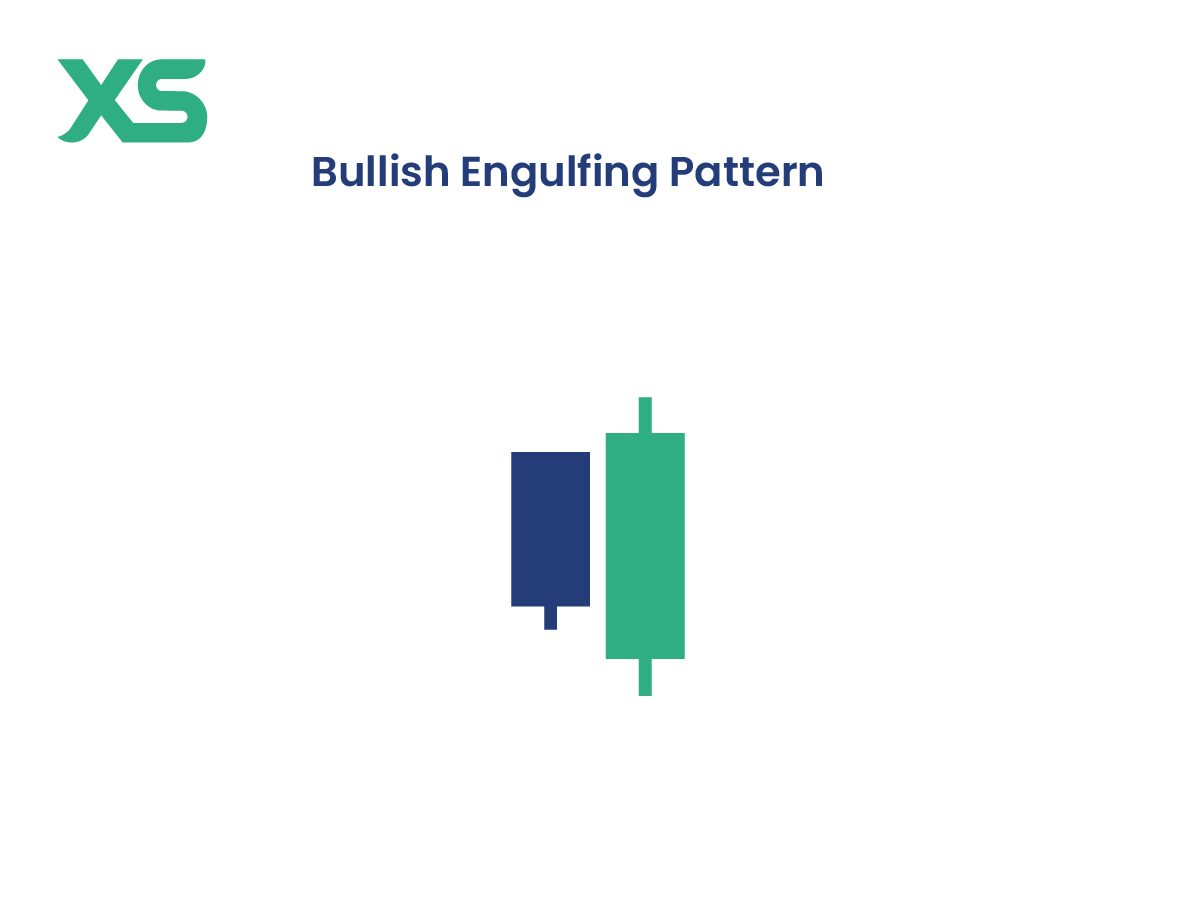
Bullish Engulfing
The Bullish Engulfing pattern consists of two candles, where the second bullish candle fully engulfs the previous bearish candle. This suggests that buyers have taken control, often leading to a trend reversal. The larger the engulfing candle, the stronger the bullish momentum.
Key Features:
-
Second candle completely engulfs the previous bearish candle’s body.
-
Appears after a downtrend, signaling a strong reversal.
-
Works best with high volume and confirmation from the next candle.
Double Candlestick Patterns
Double candlestick patterns consist of two consecutive candles that together indicate a potential bullish reversal. These patterns provide stronger signals than single candlestick patterns, as they reflect a shift in market sentiment over multiple sessions.
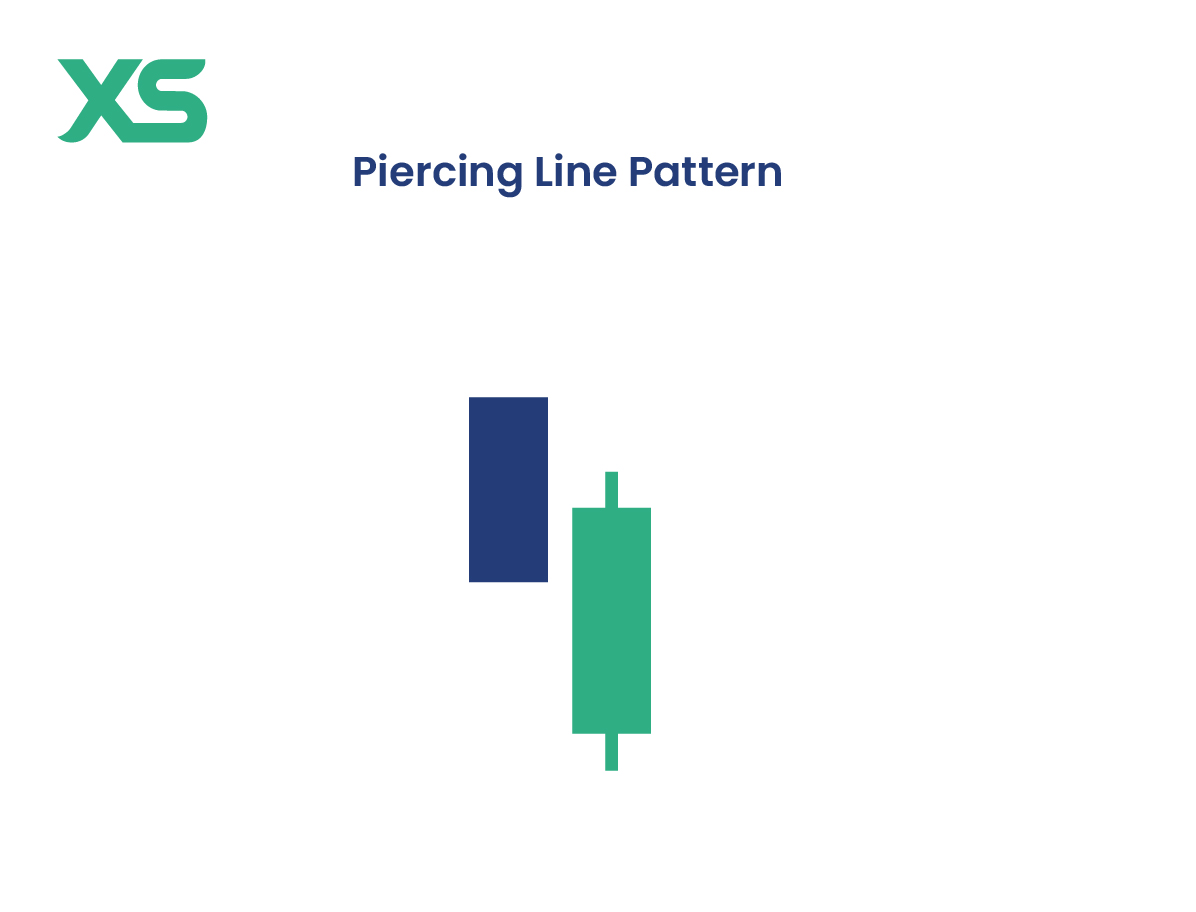
Piercing Line
The Piercing Line is a bullish candlestick pattern that appears at the end of a downtrend and consists of two candles. The first is a strong bearish candle, and the second is a bullish candle that opens below the previous close but closes above the midpoint of the bearish candle’s body. This suggests that buyers are regaining control, signaling a potential reversal.
Key Features:
-
Second candle opens lower but closes above 50% of the previous bearish candle.
-
Indicates a shift from selling pressure to buying strength.
-
More reliable when accompanied by high volume.
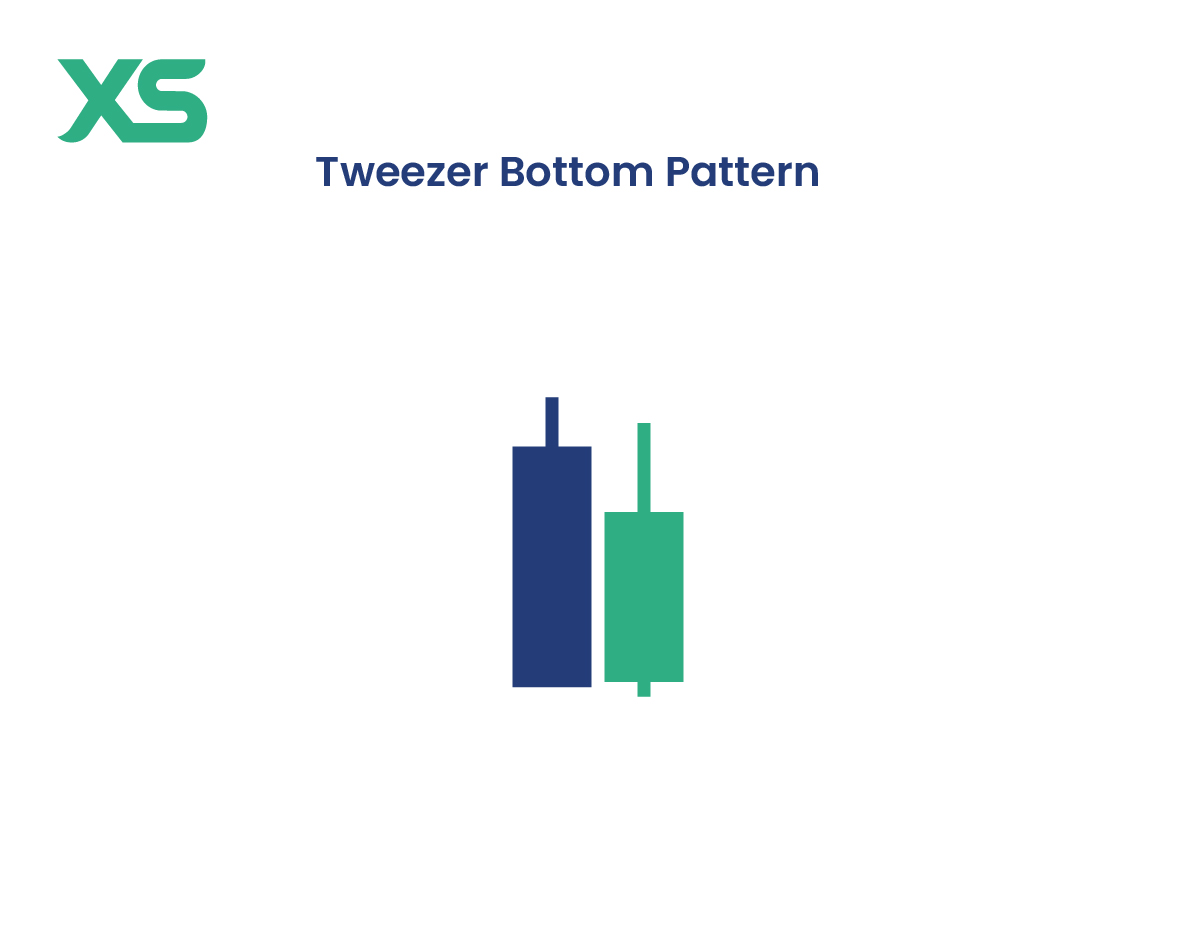
Tweezer Bottoms
Tweezer Bottoms occur when two consecutive candles have nearly identical lows, forming a strong support level. The first candle is bearish, while the second is bullish, suggesting that sellers tried to push the price lower but failed. This pattern signals a potential bullish reversal, especially when found at the bottom of a downtrend.
Key Features:
-
Two consecutive candles with matching or nearly identical lows.
-
The second candle is bullish, indicating a rejection of lower prices.
-
Stronger when formed at key support levels.
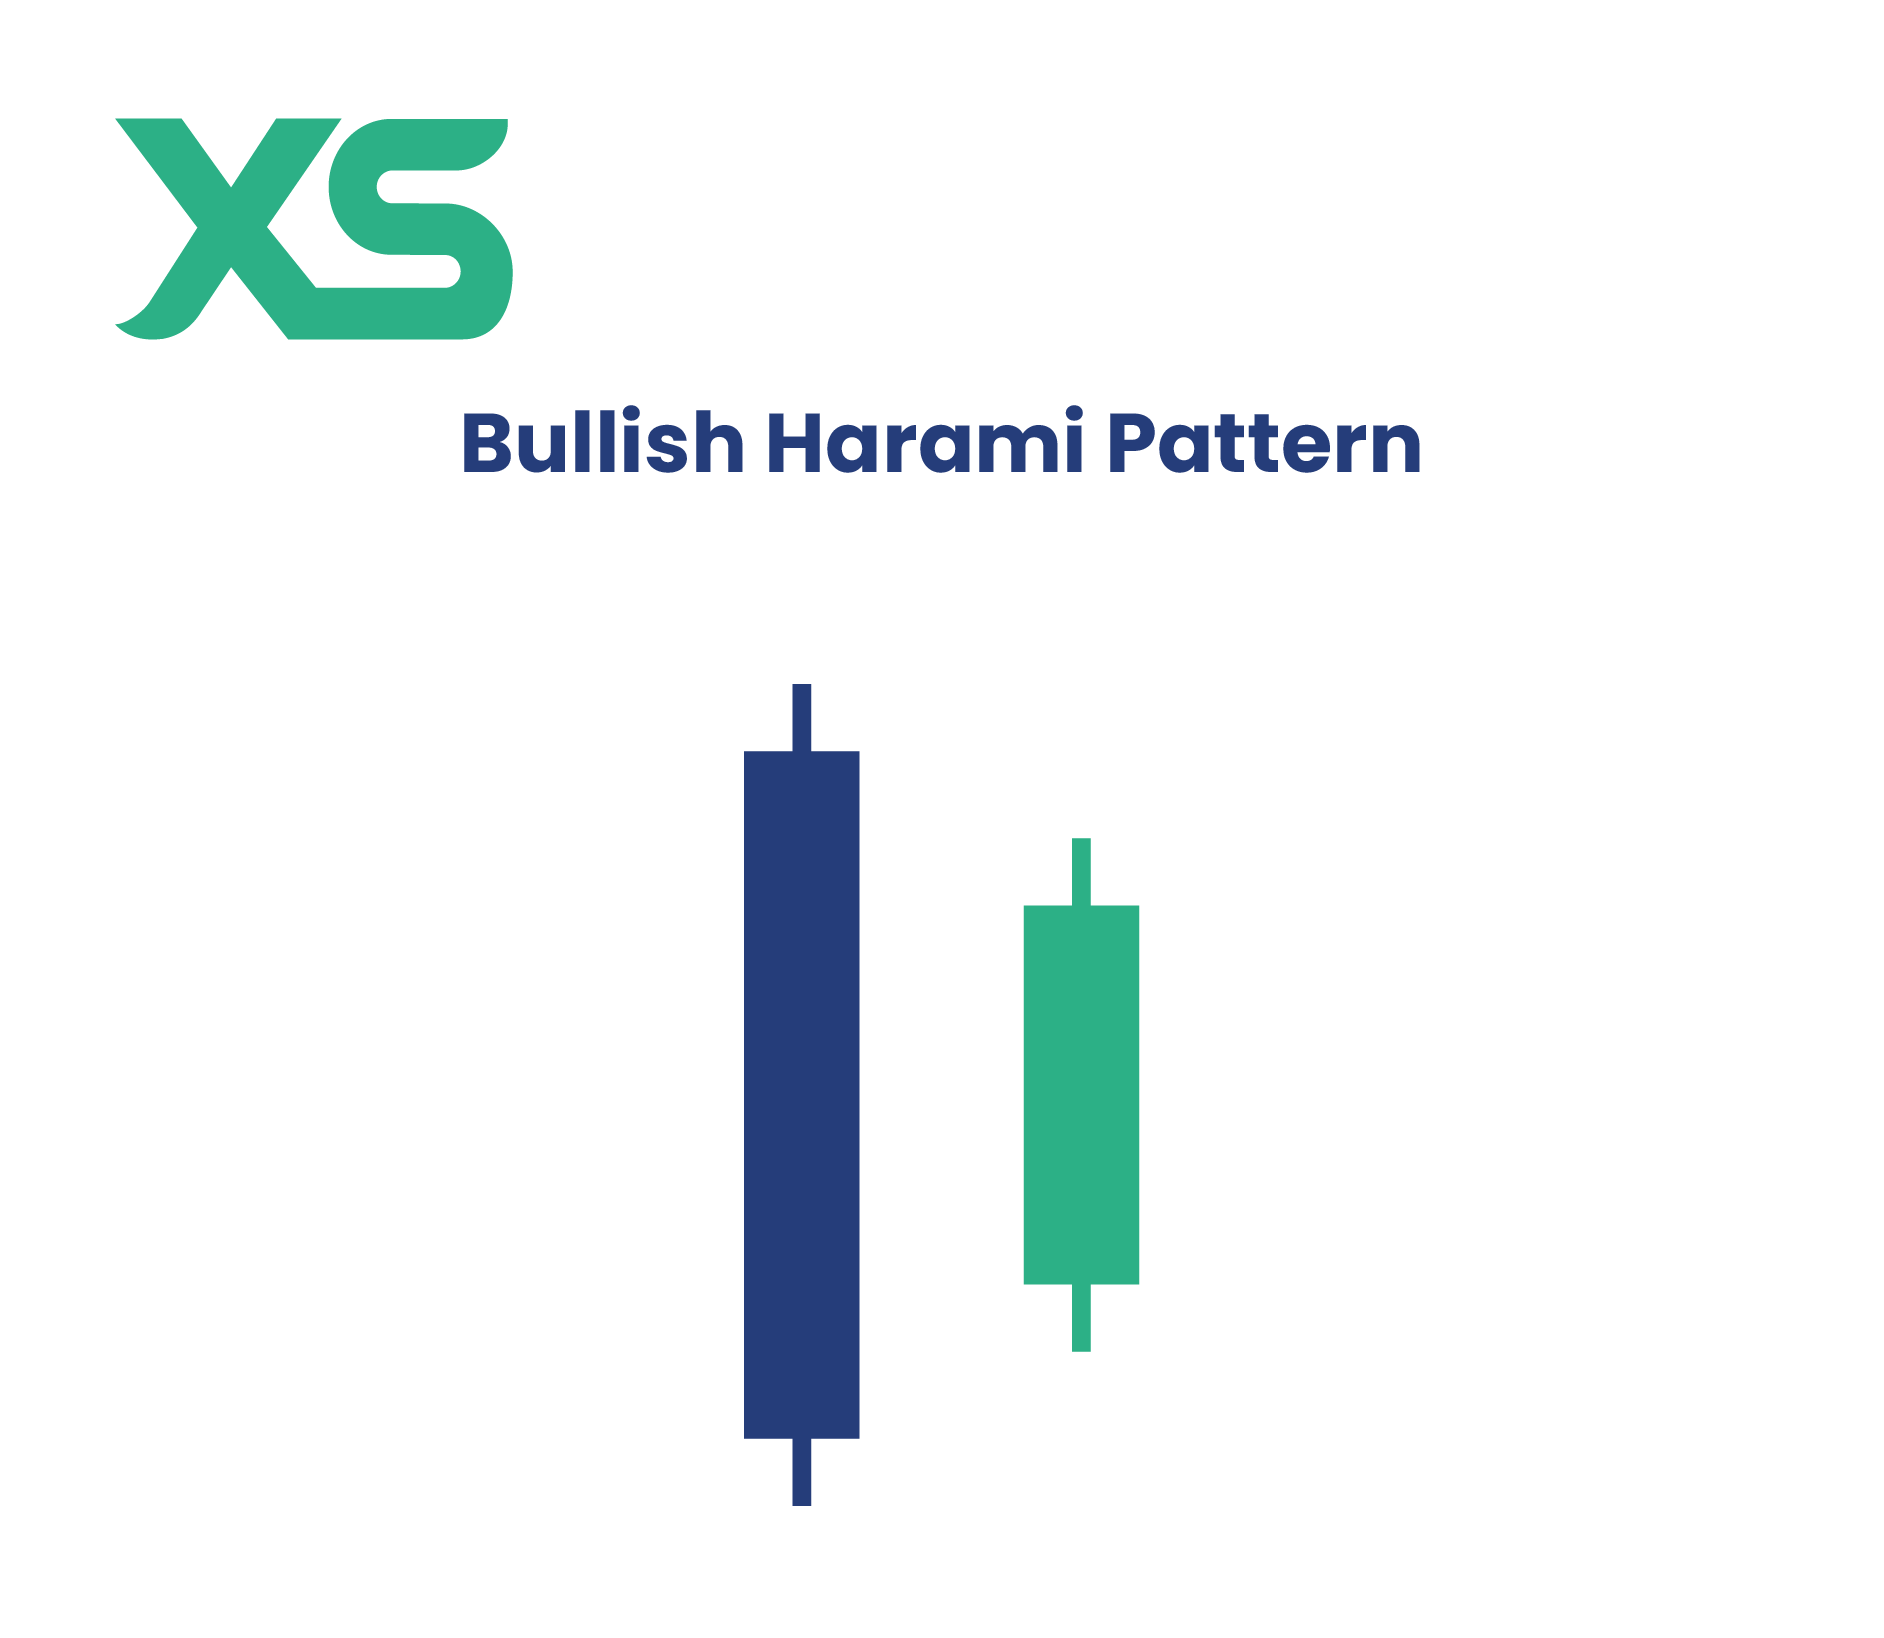
Bullish Harami
The Bullish Harami consists of a large bearish candle followed by a smaller bullish candle that is completely contained within the body of the first. This bullish candlestick pattern signals a slowdown in selling pressure and hints at a potential reversal. The smaller the second candle, the stronger the signal, as it indicates hesitation among sellers.
Key Features:
-
A small bullish candle forms within the previous bearish candle’s body.
-
Suggests a potential reversal but requires confirmation.
-
Stronger when followed by a bullish breakout.
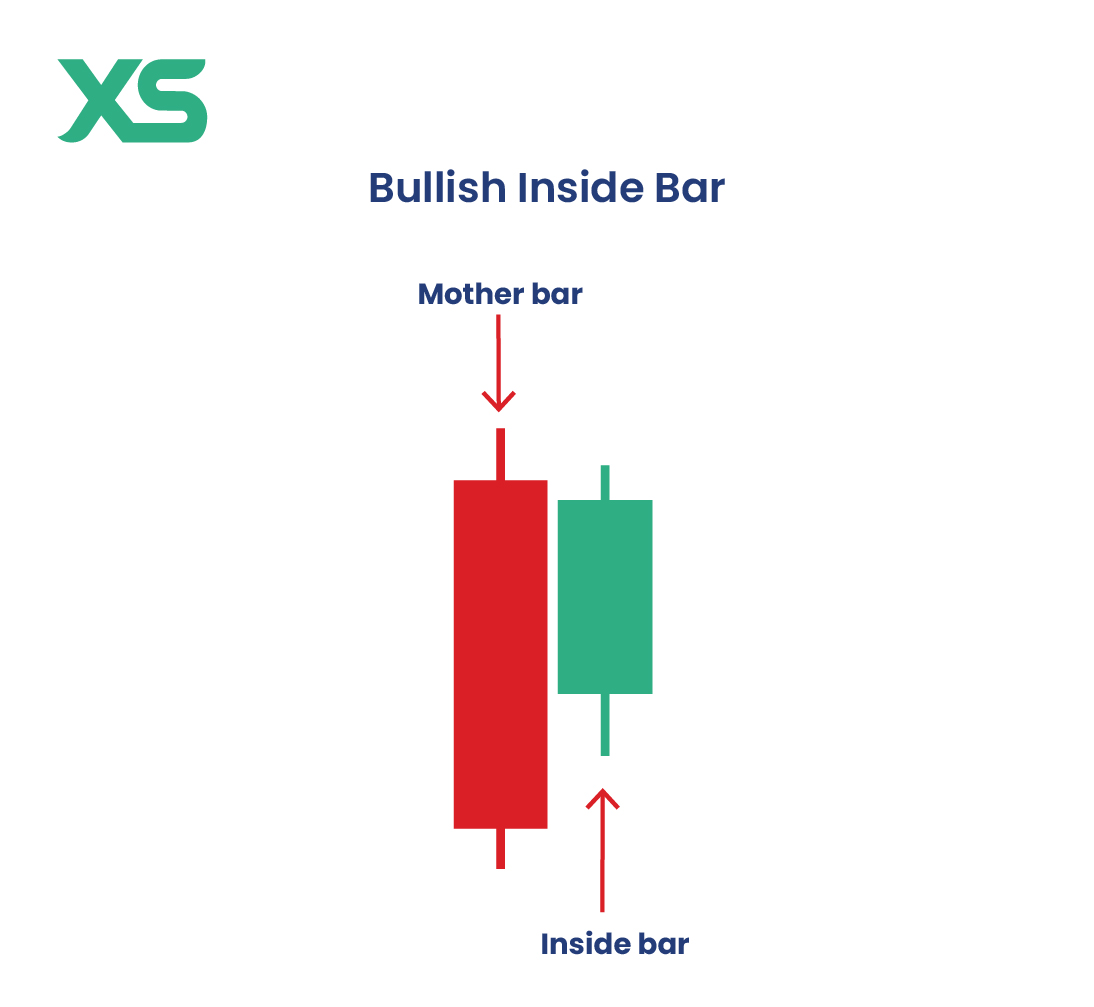
Inside Bar (Bullish)
An Inside Bar is a two-candle pattern where the second bullish candle forms entirely within the range of the previous candle. It often indicates a period of consolidation before a bullish breakout. When appearing at a support level, it signals growing buying interest and potential trend continuation.
Key Features:
-
The second candle is smaller and remains within the range of the previous candle.
-
Suggests market consolidation before a potential breakout.
-
More reliable when followed by a strong bullish move.
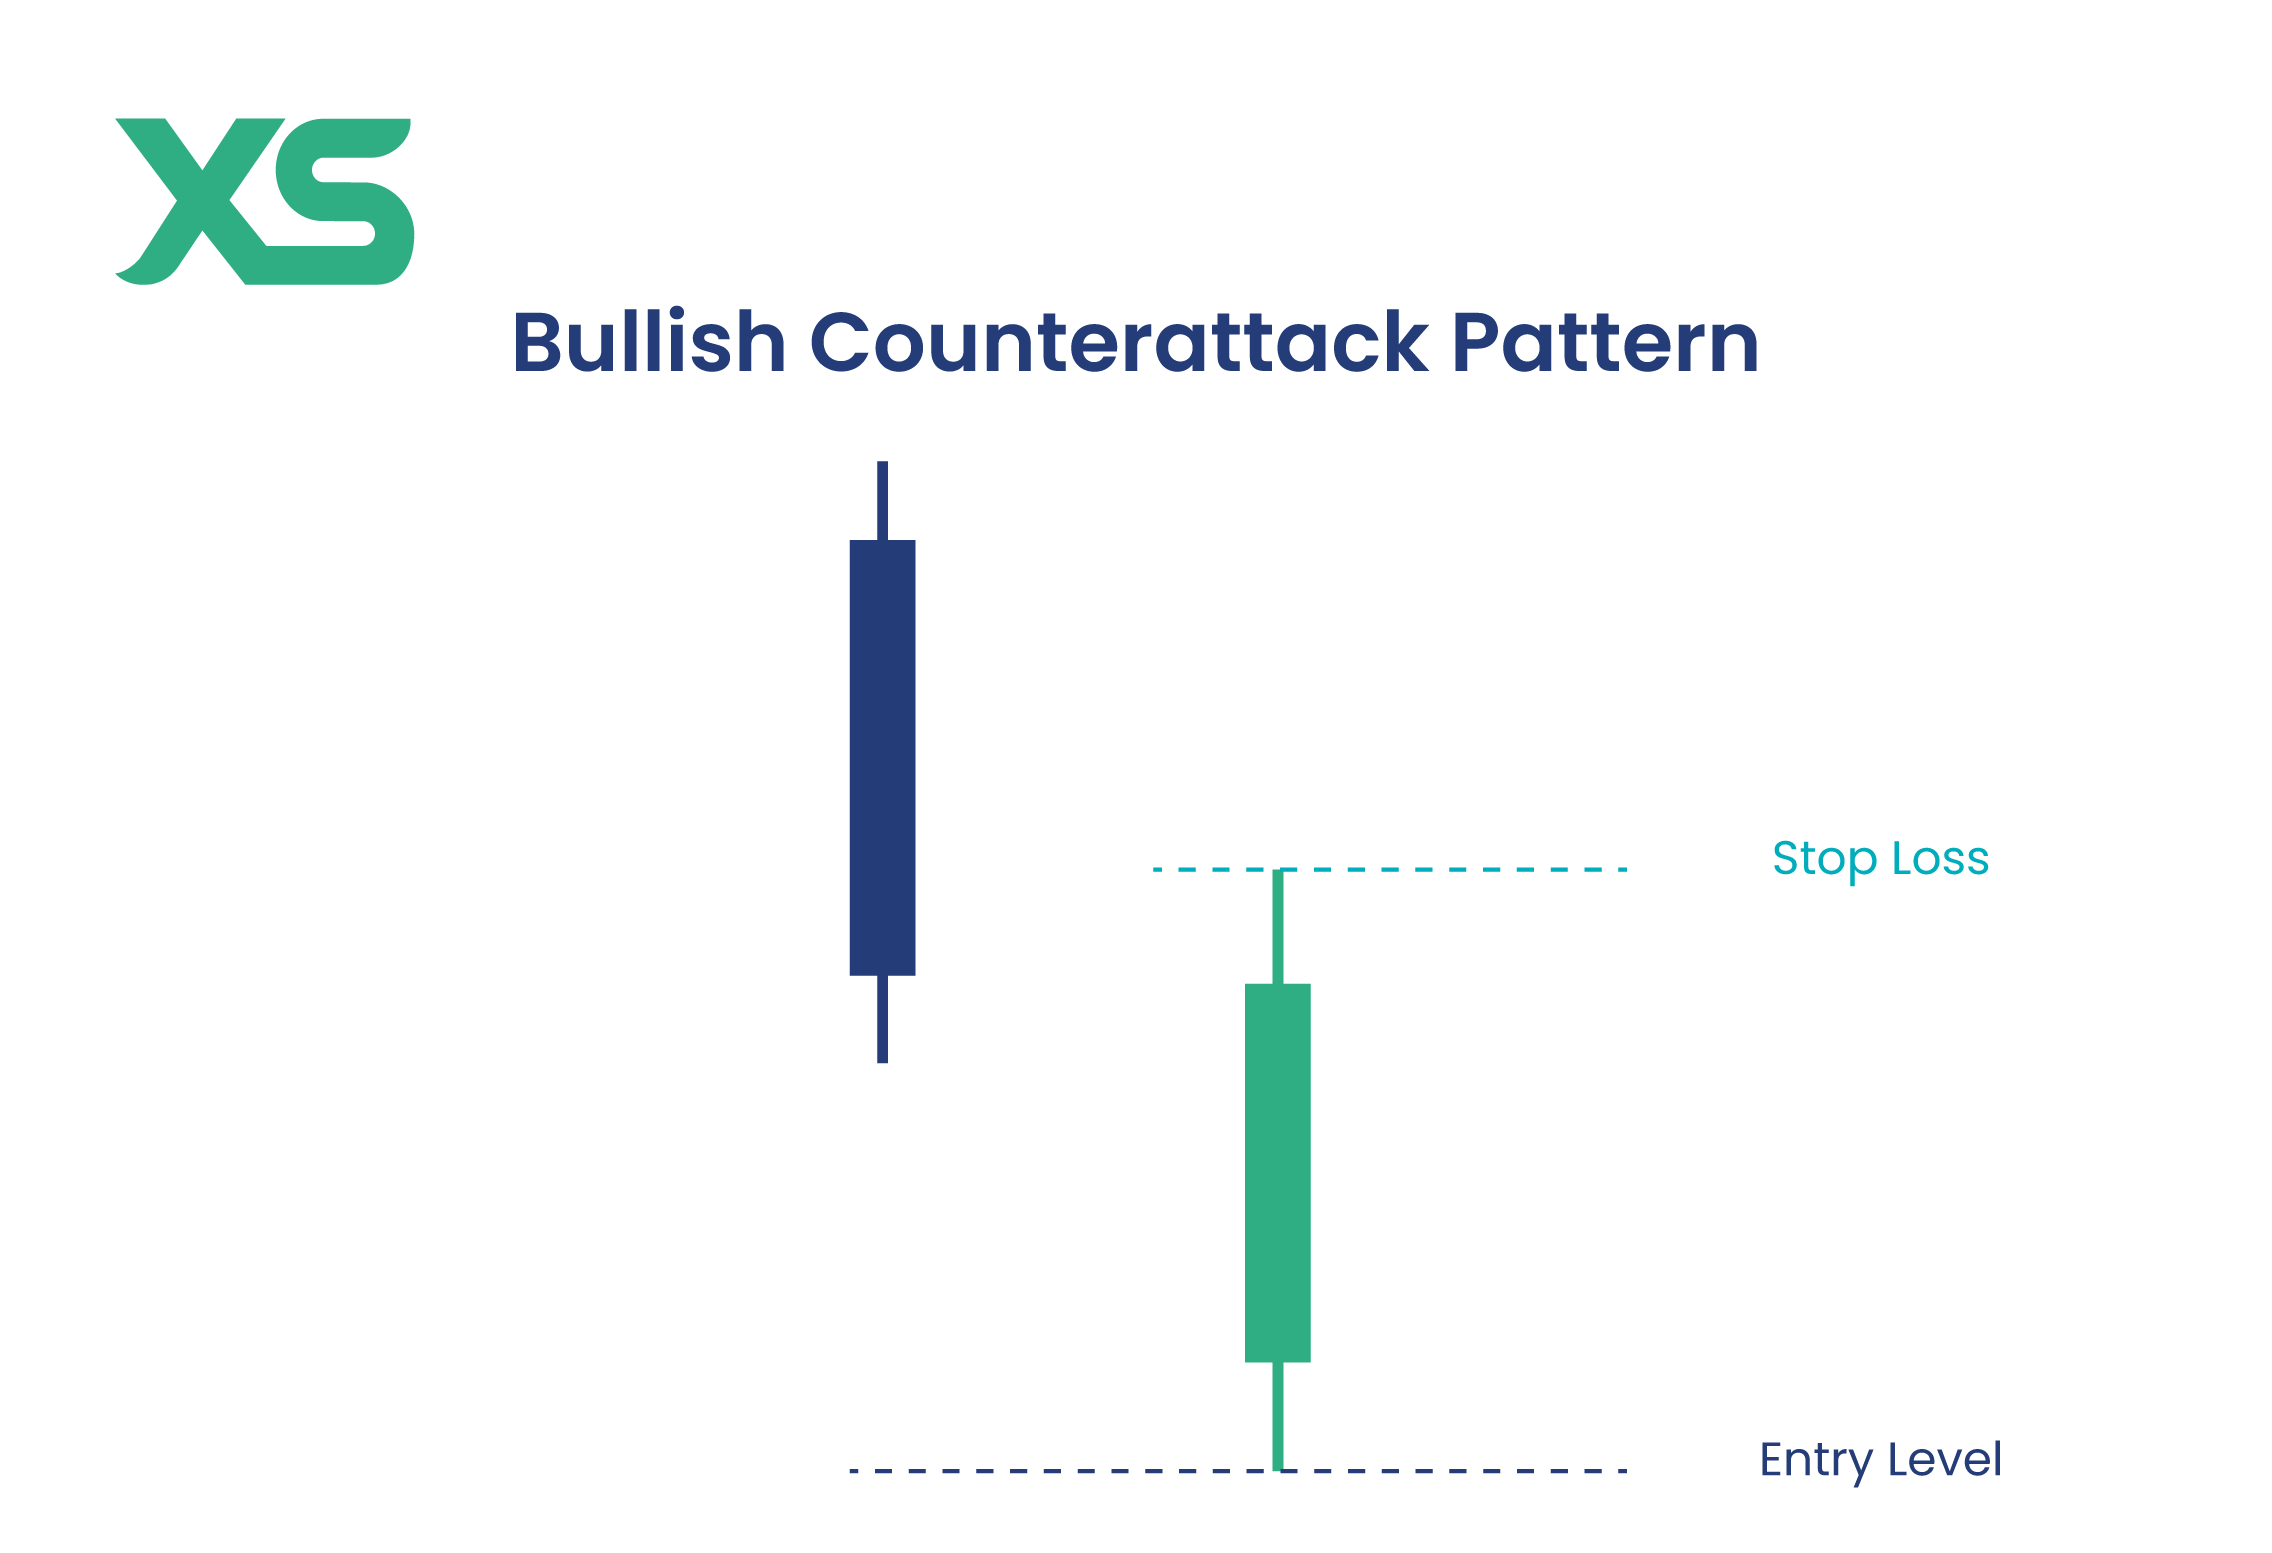
Bullish Counterattack
The Bullish Counterattack pattern occurs when a bearish candle is immediately followed by a bullish candle that opens lower but closes at the same level as the previous candle’s open. This indicates that buyers have stepped in aggressively after a sharp sell-off, signaling a potential reversal. The pattern is more effective when it forms at a key support level.
Key Features:
-
The second bullish candle opens lower but closes at the same level as the first candle’s open.
-
Indicates strong buying pressure after a sharp decline.
-
More reliable when combined with high volume and support confirmation.
Triple Candlestick Patterns
Triple candlestick patterns consist of three consecutive candles that confirm a stronger shift in market sentiment. These patterns help traders identify trend reversals or continuations with higher reliability than single or double candlestick formations.
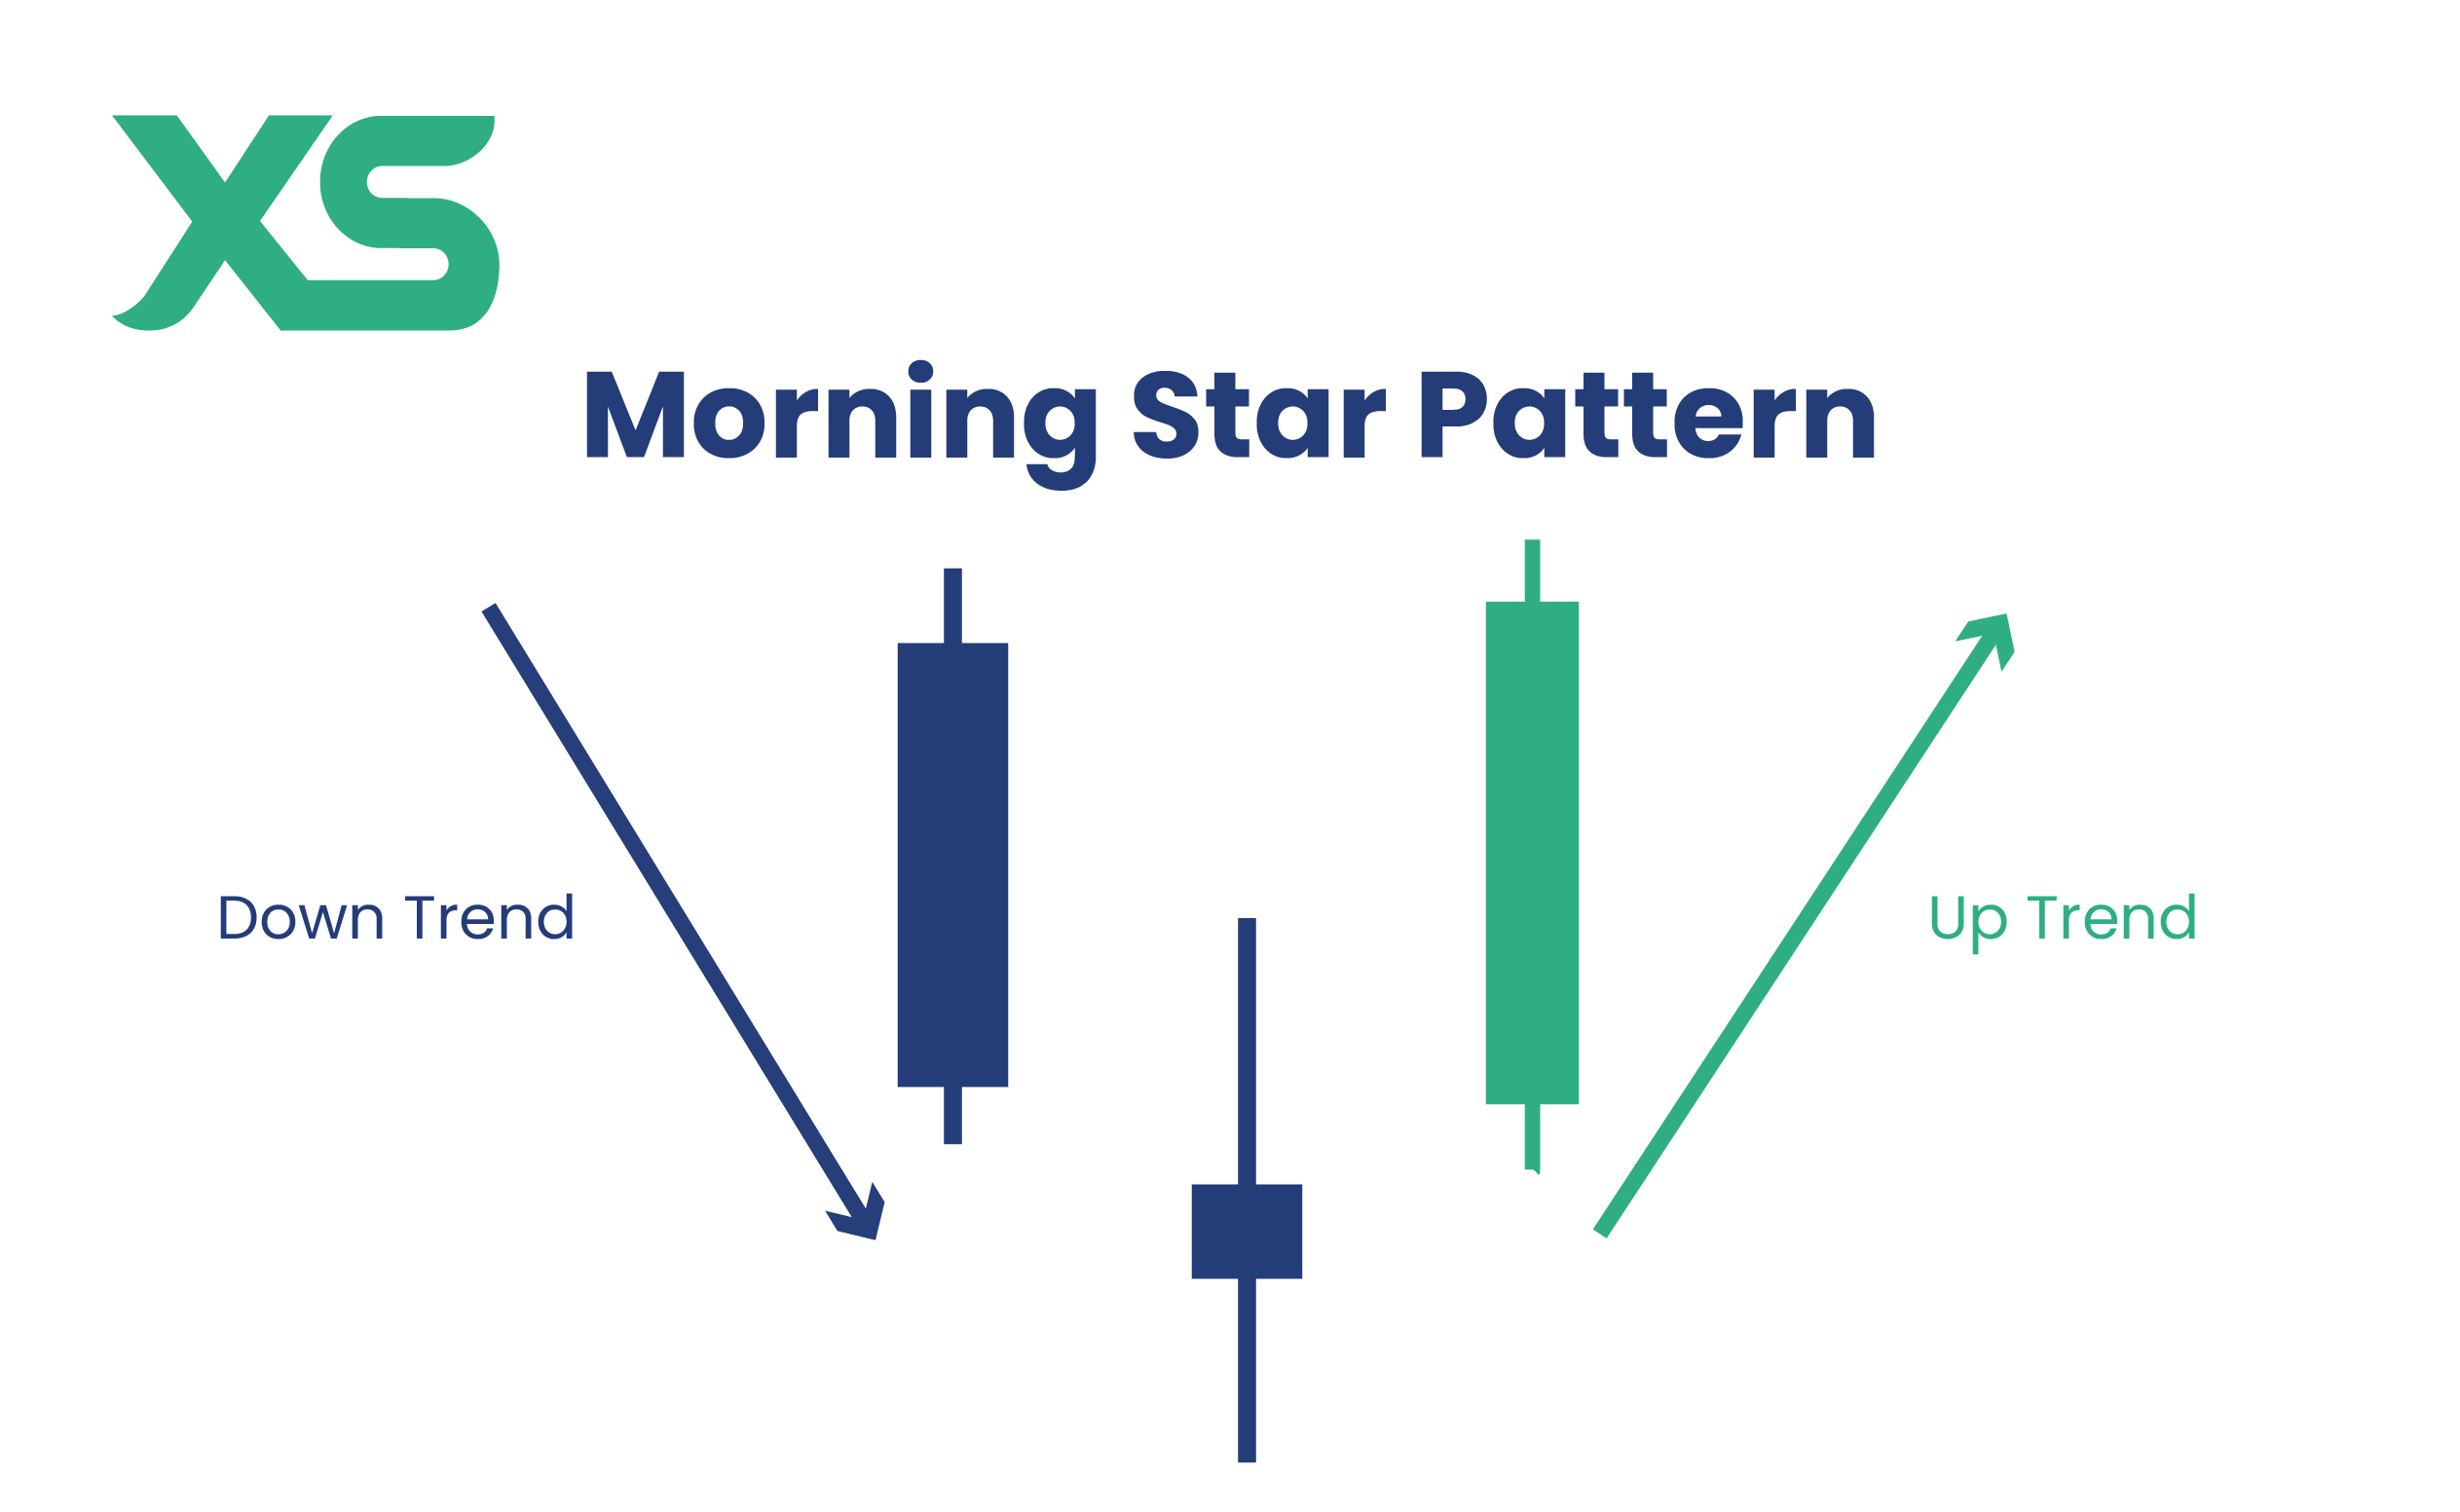
Morning Star
The Morning Star is a three-candle pattern that signals a bullish reversal. It begins with a strong bearish candle, followed by a small-bodied candle (which can be bullish or bearish) that shows market hesitation, and ends with a large bullish candle that confirms the reversal. This bullish candlestick pattern suggests that selling pressure is weakening and buyers are taking control.
Key Features:
-
Consists of a bearish candle, a small indecisive candle, and a strong bullish candle.
-
Appears at the bottom of a downtrend, signaling a potential reversal.
-
More reliable when the third candle closes above the midpoint of the first candle.
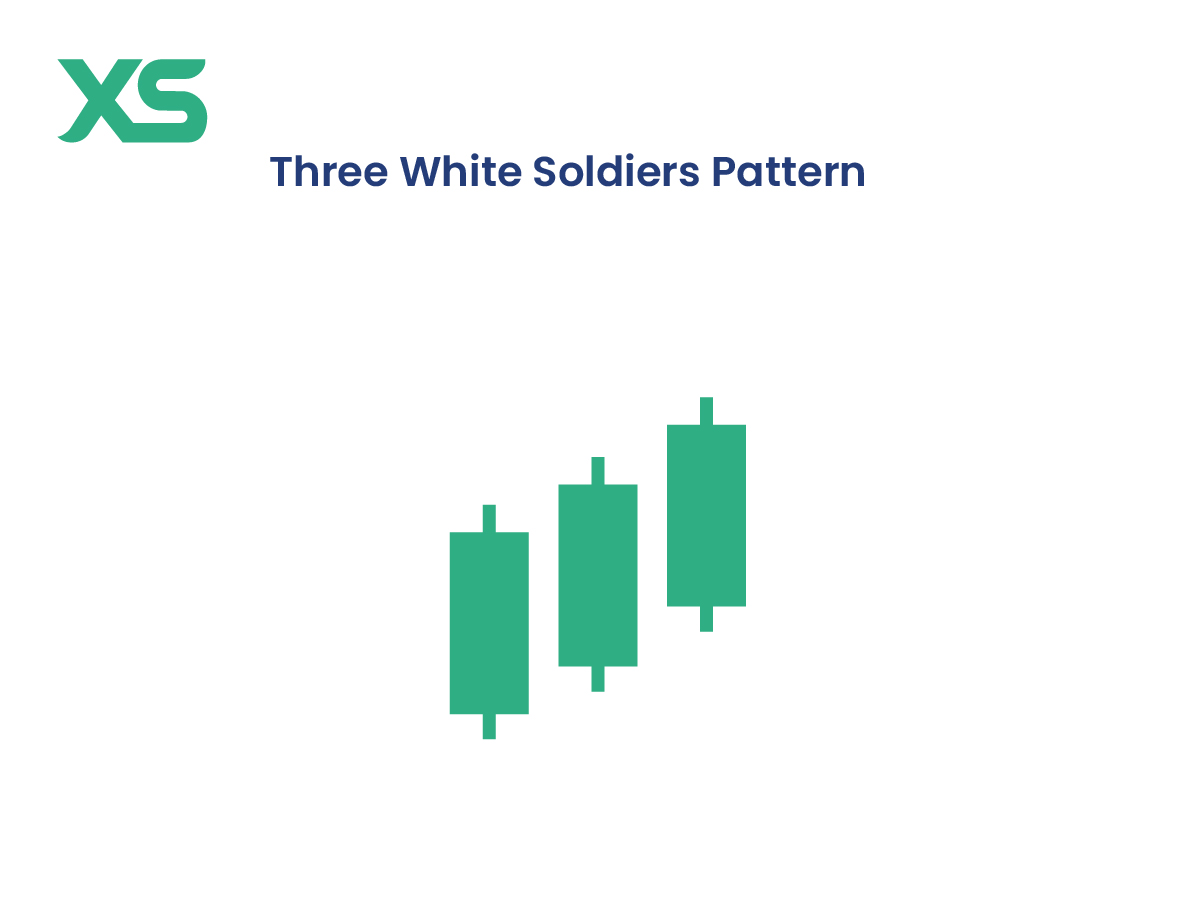
Three White Soldiers
The Three White Soldiers pattern consists of three consecutive long bullish candles, each opening within the previous candle’s body and closing near the high. This pattern indicates strong buying momentum and suggests the continuation of an uptrend. It is considered one of the most reliable bullish reversal patterns, especially after a prolonged downtrend.
Key Features:
-
Three consecutive bullish candles with higher closes.
-
Indicates strong buyer dominance and trend continuation.
-
More effective when supported by increasing volume.
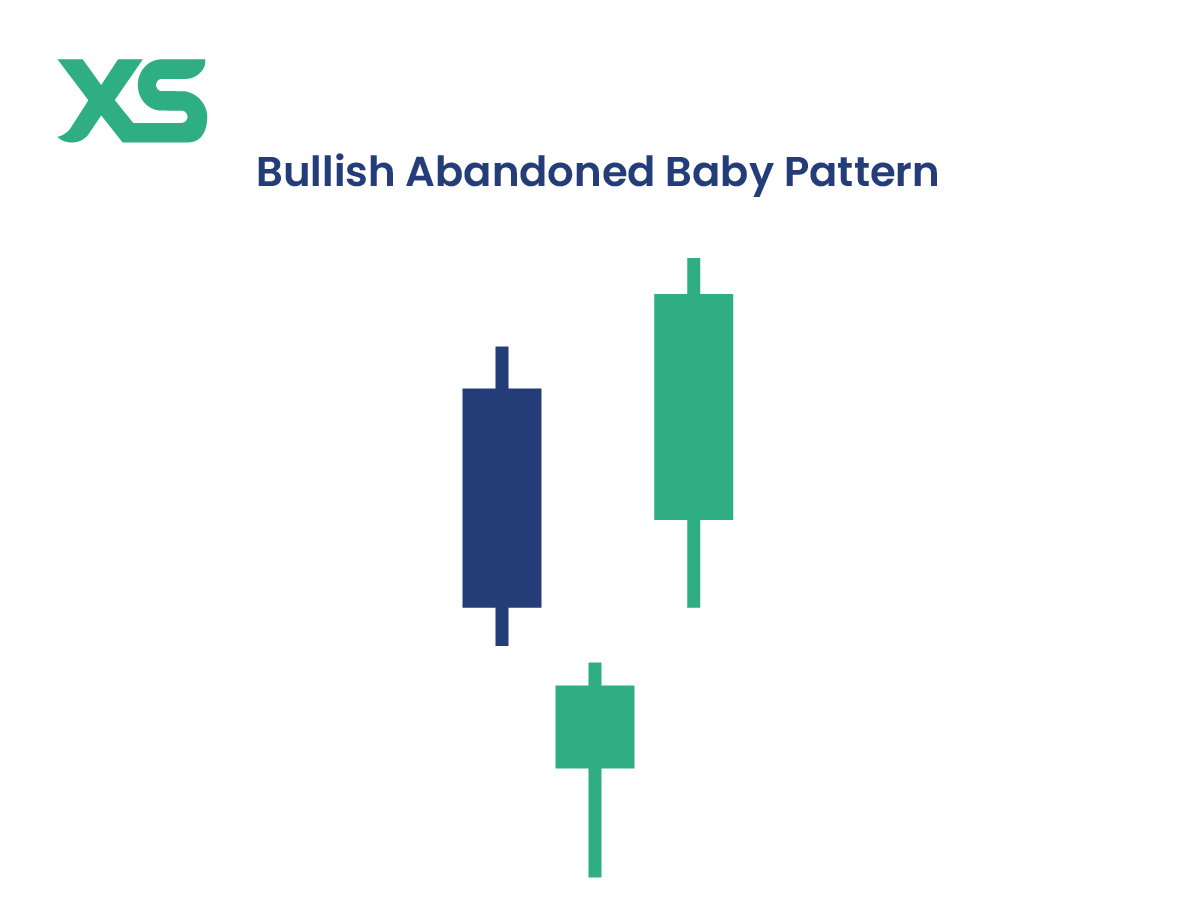
Bullish Abandoned Baby
The Bullish Abandoned Baby is a rare but powerful reversal pattern. It consists of a bearish candle, followed by a doji (a candle with an open and close at nearly the same price) that gaps below the first candle, and then a strong bullish candle that gaps up. This pattern signals a dramatic shift from bearish to bullish sentiment.
Key Features:
-
A three-candle formation with a doji that gaps down and a bullish candle that gaps up.
-
Indicates a sharp shift from selling pressure to strong buying momentum.
-
More reliable when formed at a key support level.
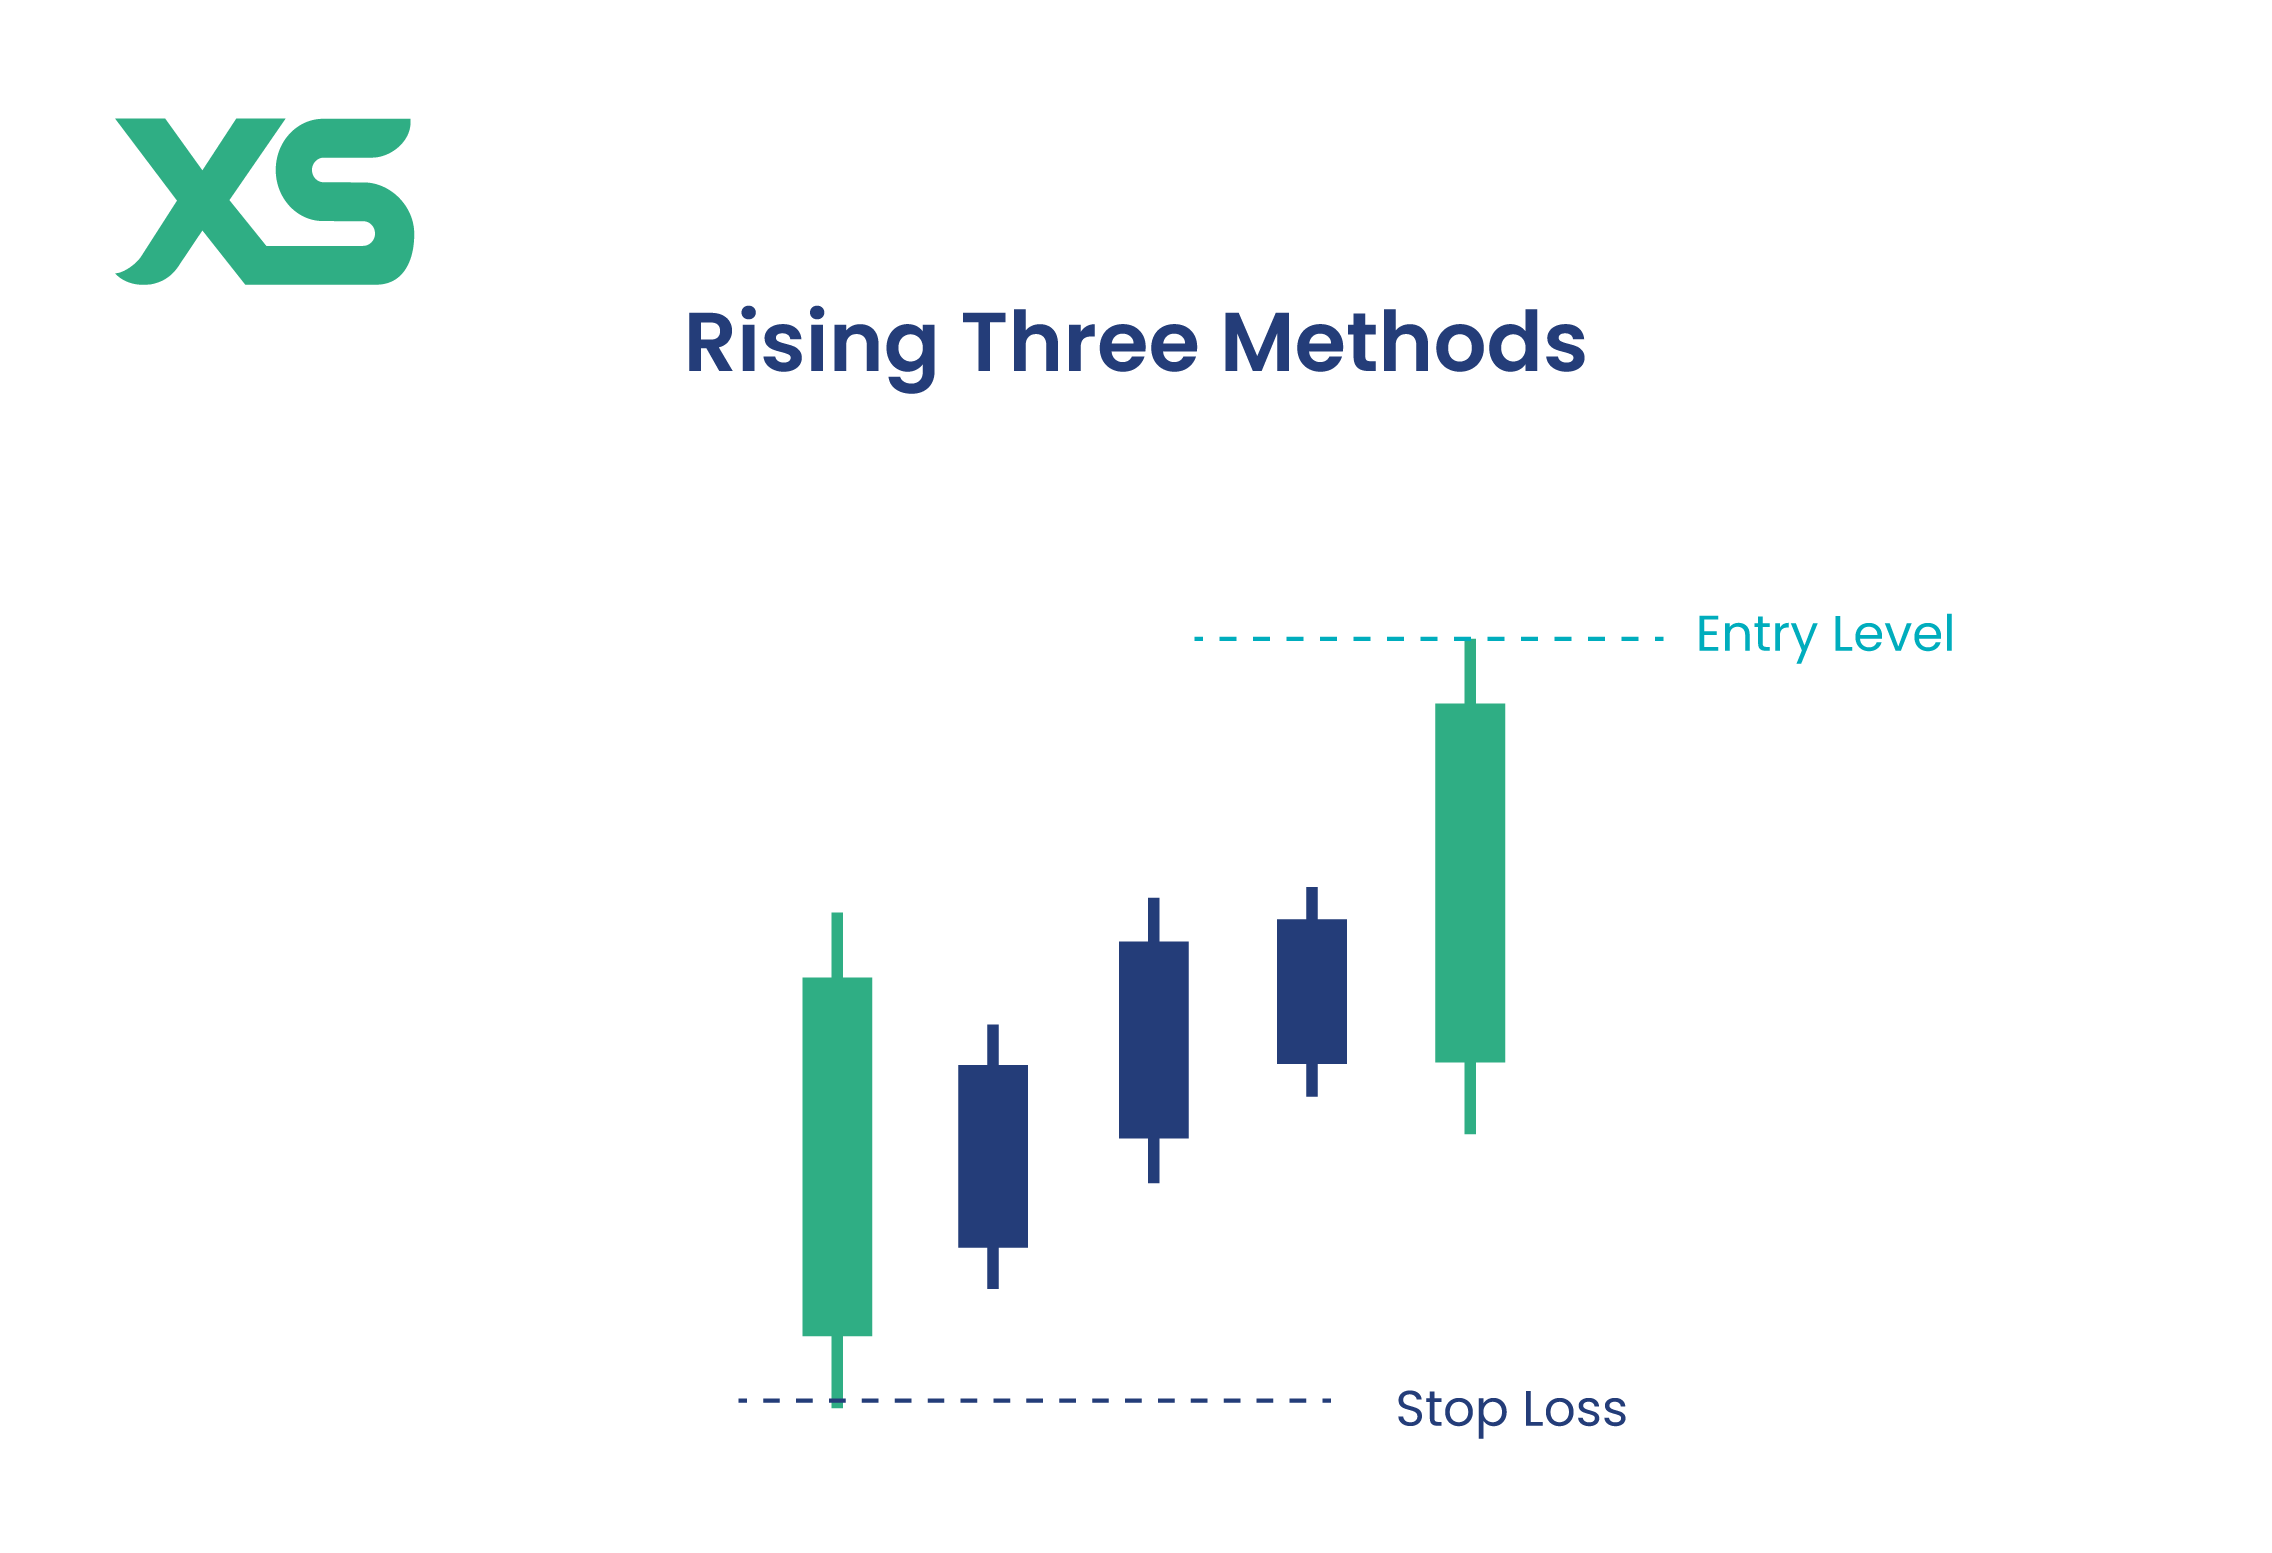
Rising Three Methods
The Rising Three Methods is a bullish continuation pattern that appears in an uptrend. It consists of a long bullish candle, followed by several smaller bearish candles that stay within the range of the first candle, and then another strong bullish candle that resumes the upward trend. This pattern signals a brief consolidation before the uptrend continues.
Key Features:
-
A strong bullish candle, followed by 2–4 small bearish candles, and another bullish candle.
-
The small bearish candles remain within the range of the first bullish candle.
-
Confirms that the uptrend is still strong despite temporary pullbacks.
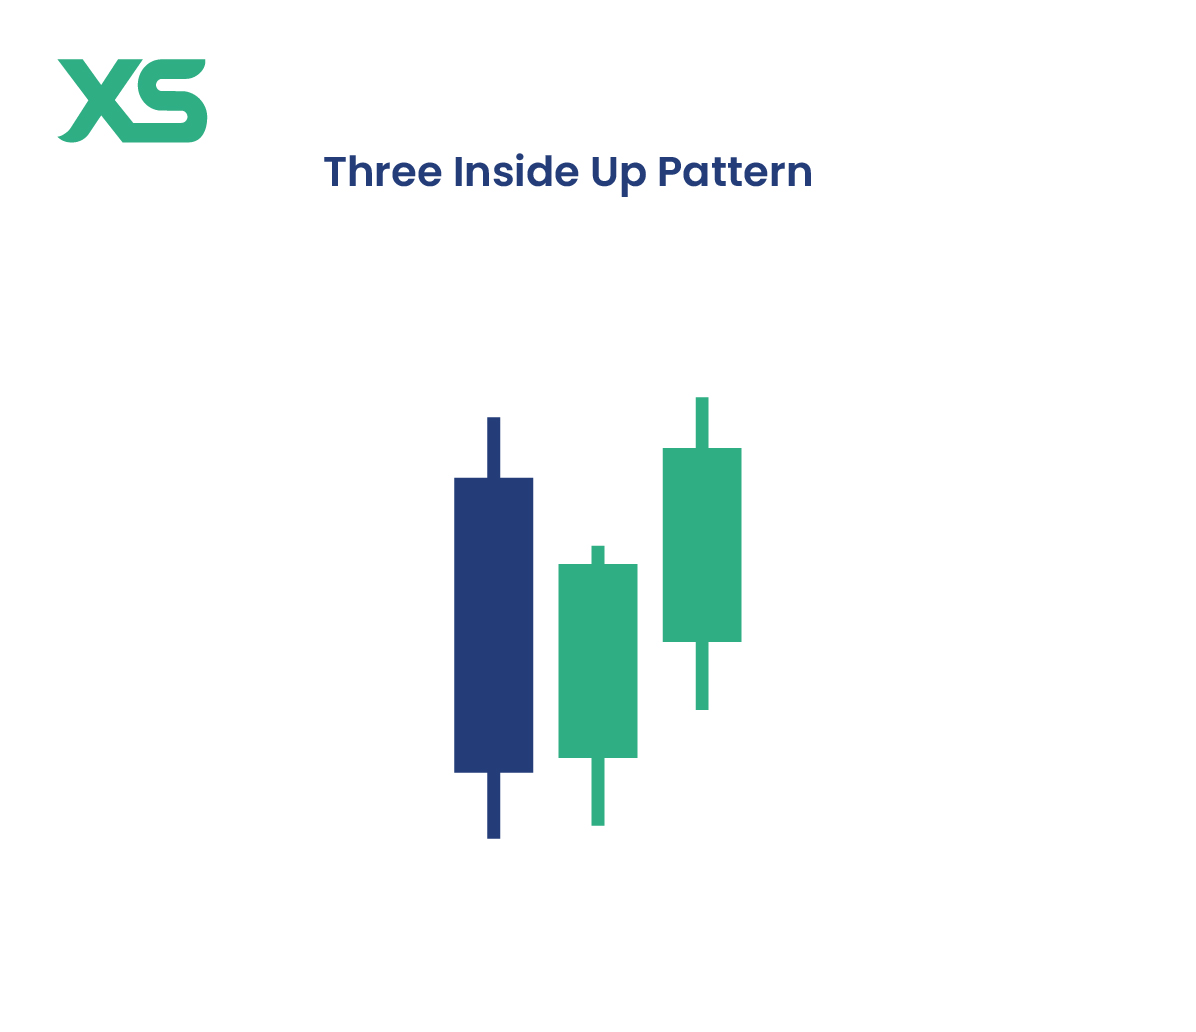
Three Inside Up
The Three Inside Up is a bullish reversal pattern that builds on the Bullish Harami. It starts with a large bearish candle, followed by a smaller bullish candle within its range, and then a third bullish candle that closes above the high of the first candle. This pattern confirms a shift from bearish to bullish momentum.
Key Features:
-
A bearish candle, followed by a small bullish candle within its range.
-
The third bullish candle closes above the high of the first candle, confirming the reversal.
-
More effective when formed at a key support level.
Complex Bullish Patterns
Complex bullish patterns involve multiple candles and indicate strong trend reversals or continuations. These patterns provide traders with valuable insights into market momentum and can help confirm potential entry points.
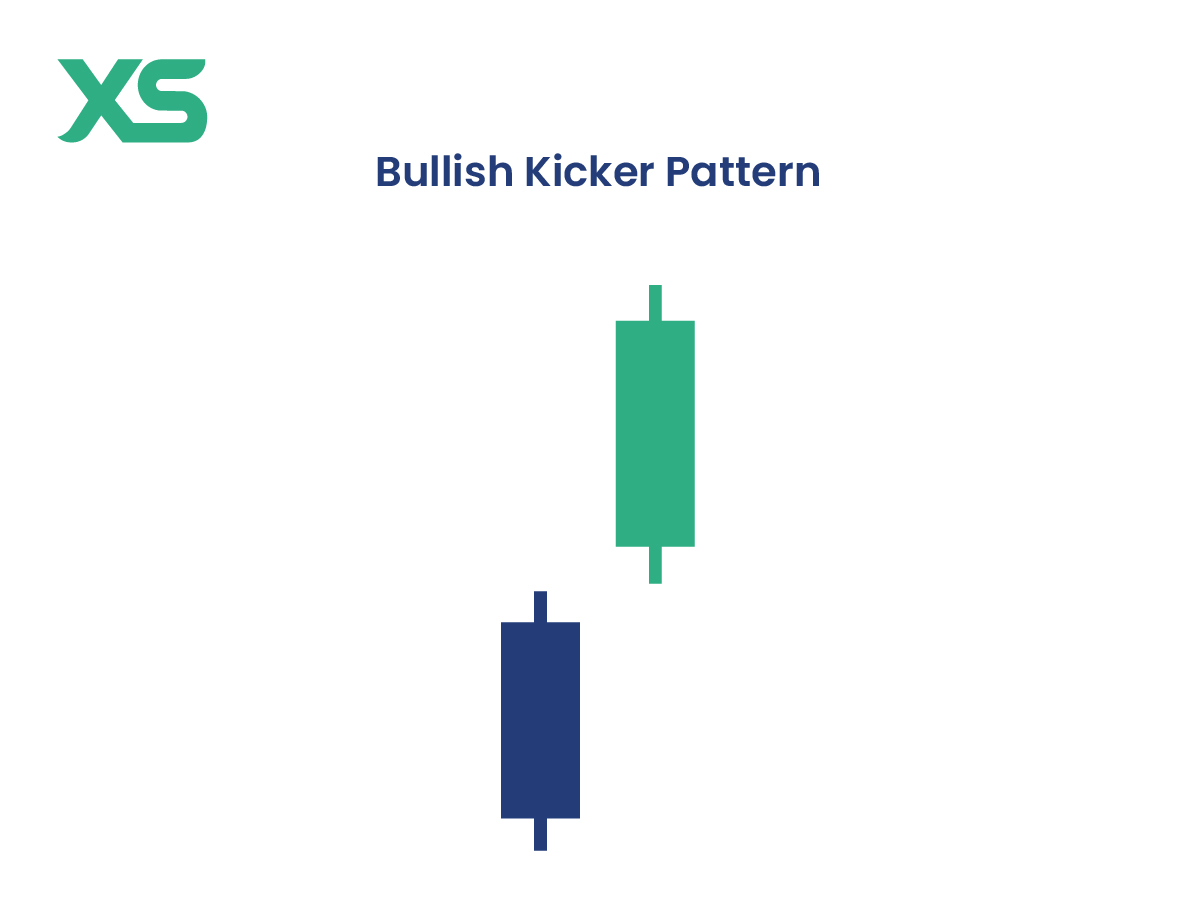
Bullish Kicker
The Bullish Kicker is a bullish reversal pattern that forms when a strong bullish candle follows a large bearish candle, with a noticeable gap between them. This pattern signals an abrupt shift in sentiment, often due to major news or a fundamental event, causing buyers to take full control.
Key Features:
-
A large bearish candle followed by a strong bullish candle with a gap.
-
No overlap between the two candles, indicating a sharp sentiment shift.
-
Often seen in high-volume markets after important news events.
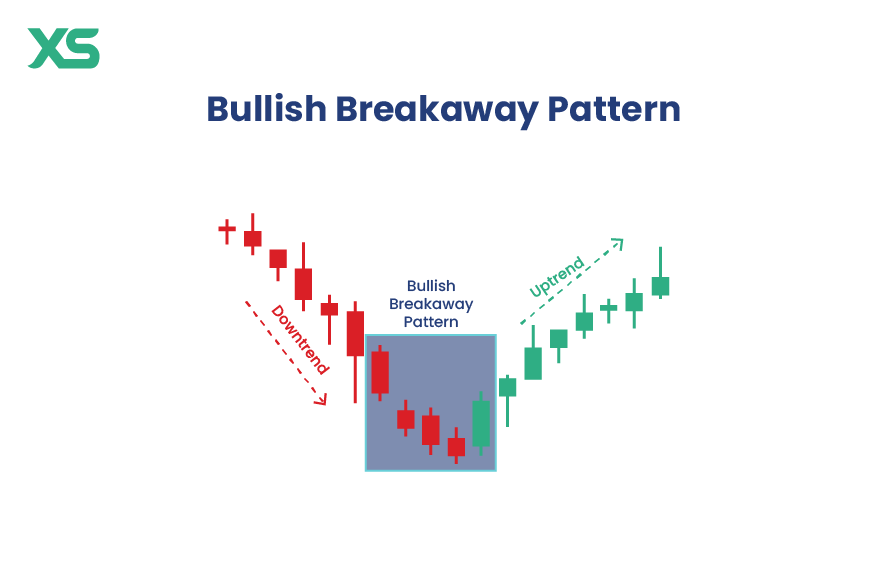
Bullish Breakaway
The Bullish Breakaway is a five-candle reversal pattern that starts with a strong bearish candle, followed by three smaller bearish candles in a downtrend. The fifth candle is a large bullish candle that closes above the high of the first bearish candle, confirming the reversal.
Key Features:
-
Five-candle pattern showing a transition from bearish to bullish.
-
The last bullish candle closes above the high of the first bearish candle.
-
Signals a strong reversal, especially when supported by high volume.
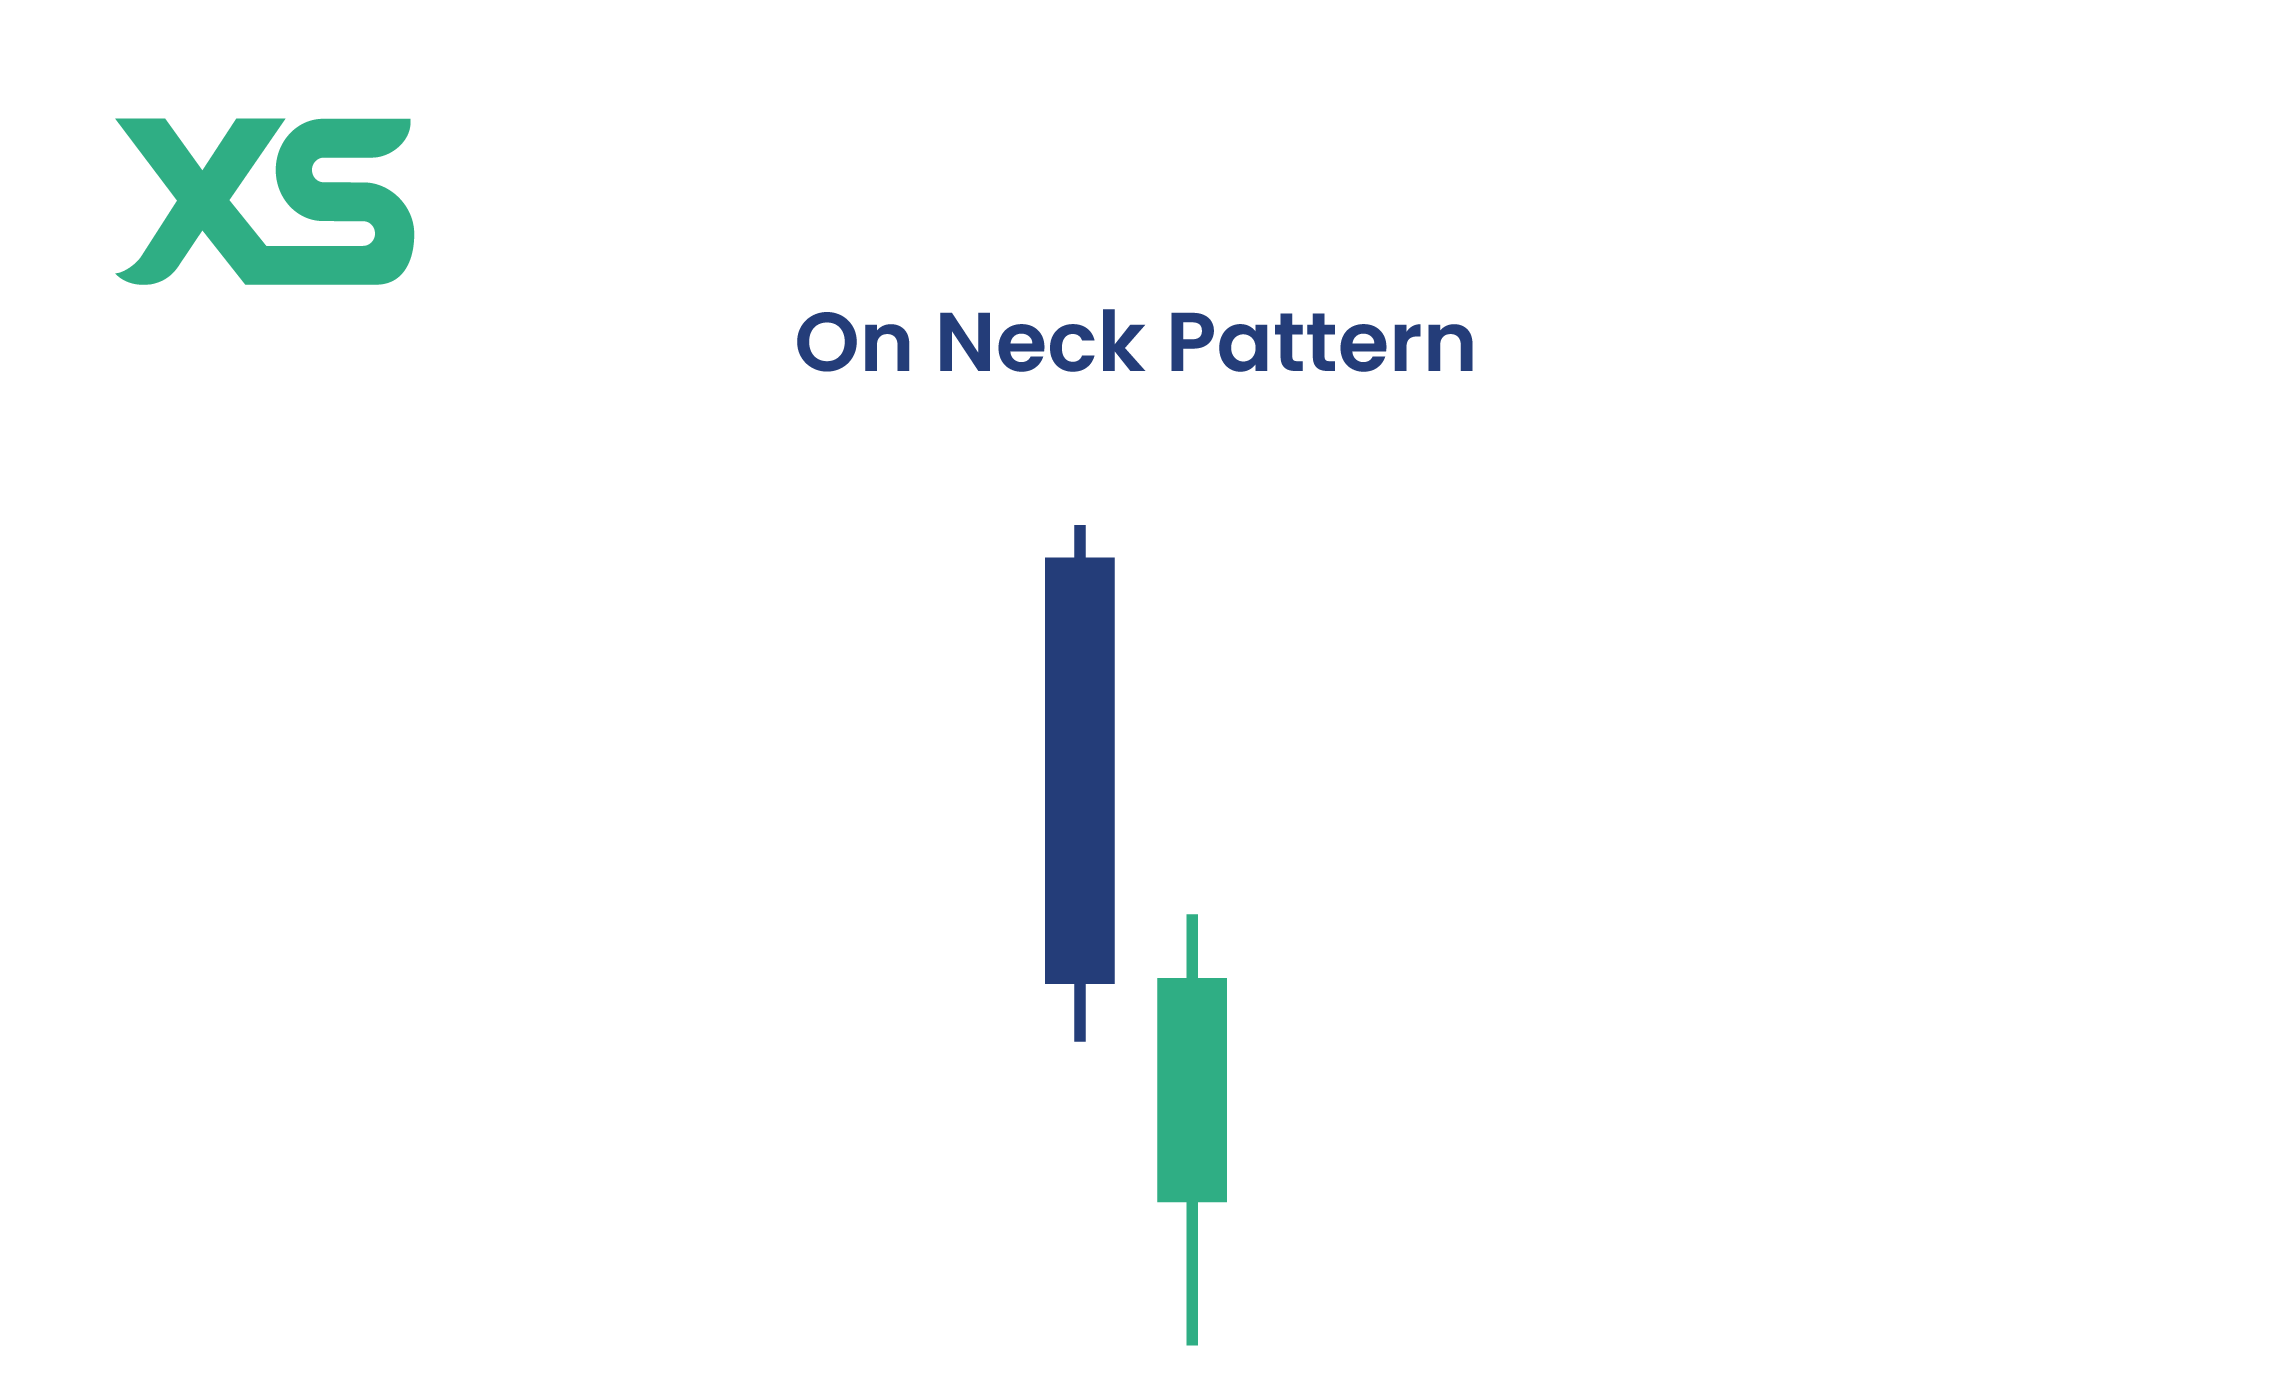
On-Neck Pattern
The On-Neck Pattern is a bullish continuation pattern that forms in an uptrend. It consists of a bullish candle followed by a small bearish candle that closes near the previous candle’s low, suggesting a temporary pause before the uptrend resumes.
Key Features:
-
A bullish candle followed by a small bearish candle with a closing price near the previous low.
-
Indicates a slight pullback but confirms trend continuation.
-
Works best when followed by another bullish candle breaking above resistance.
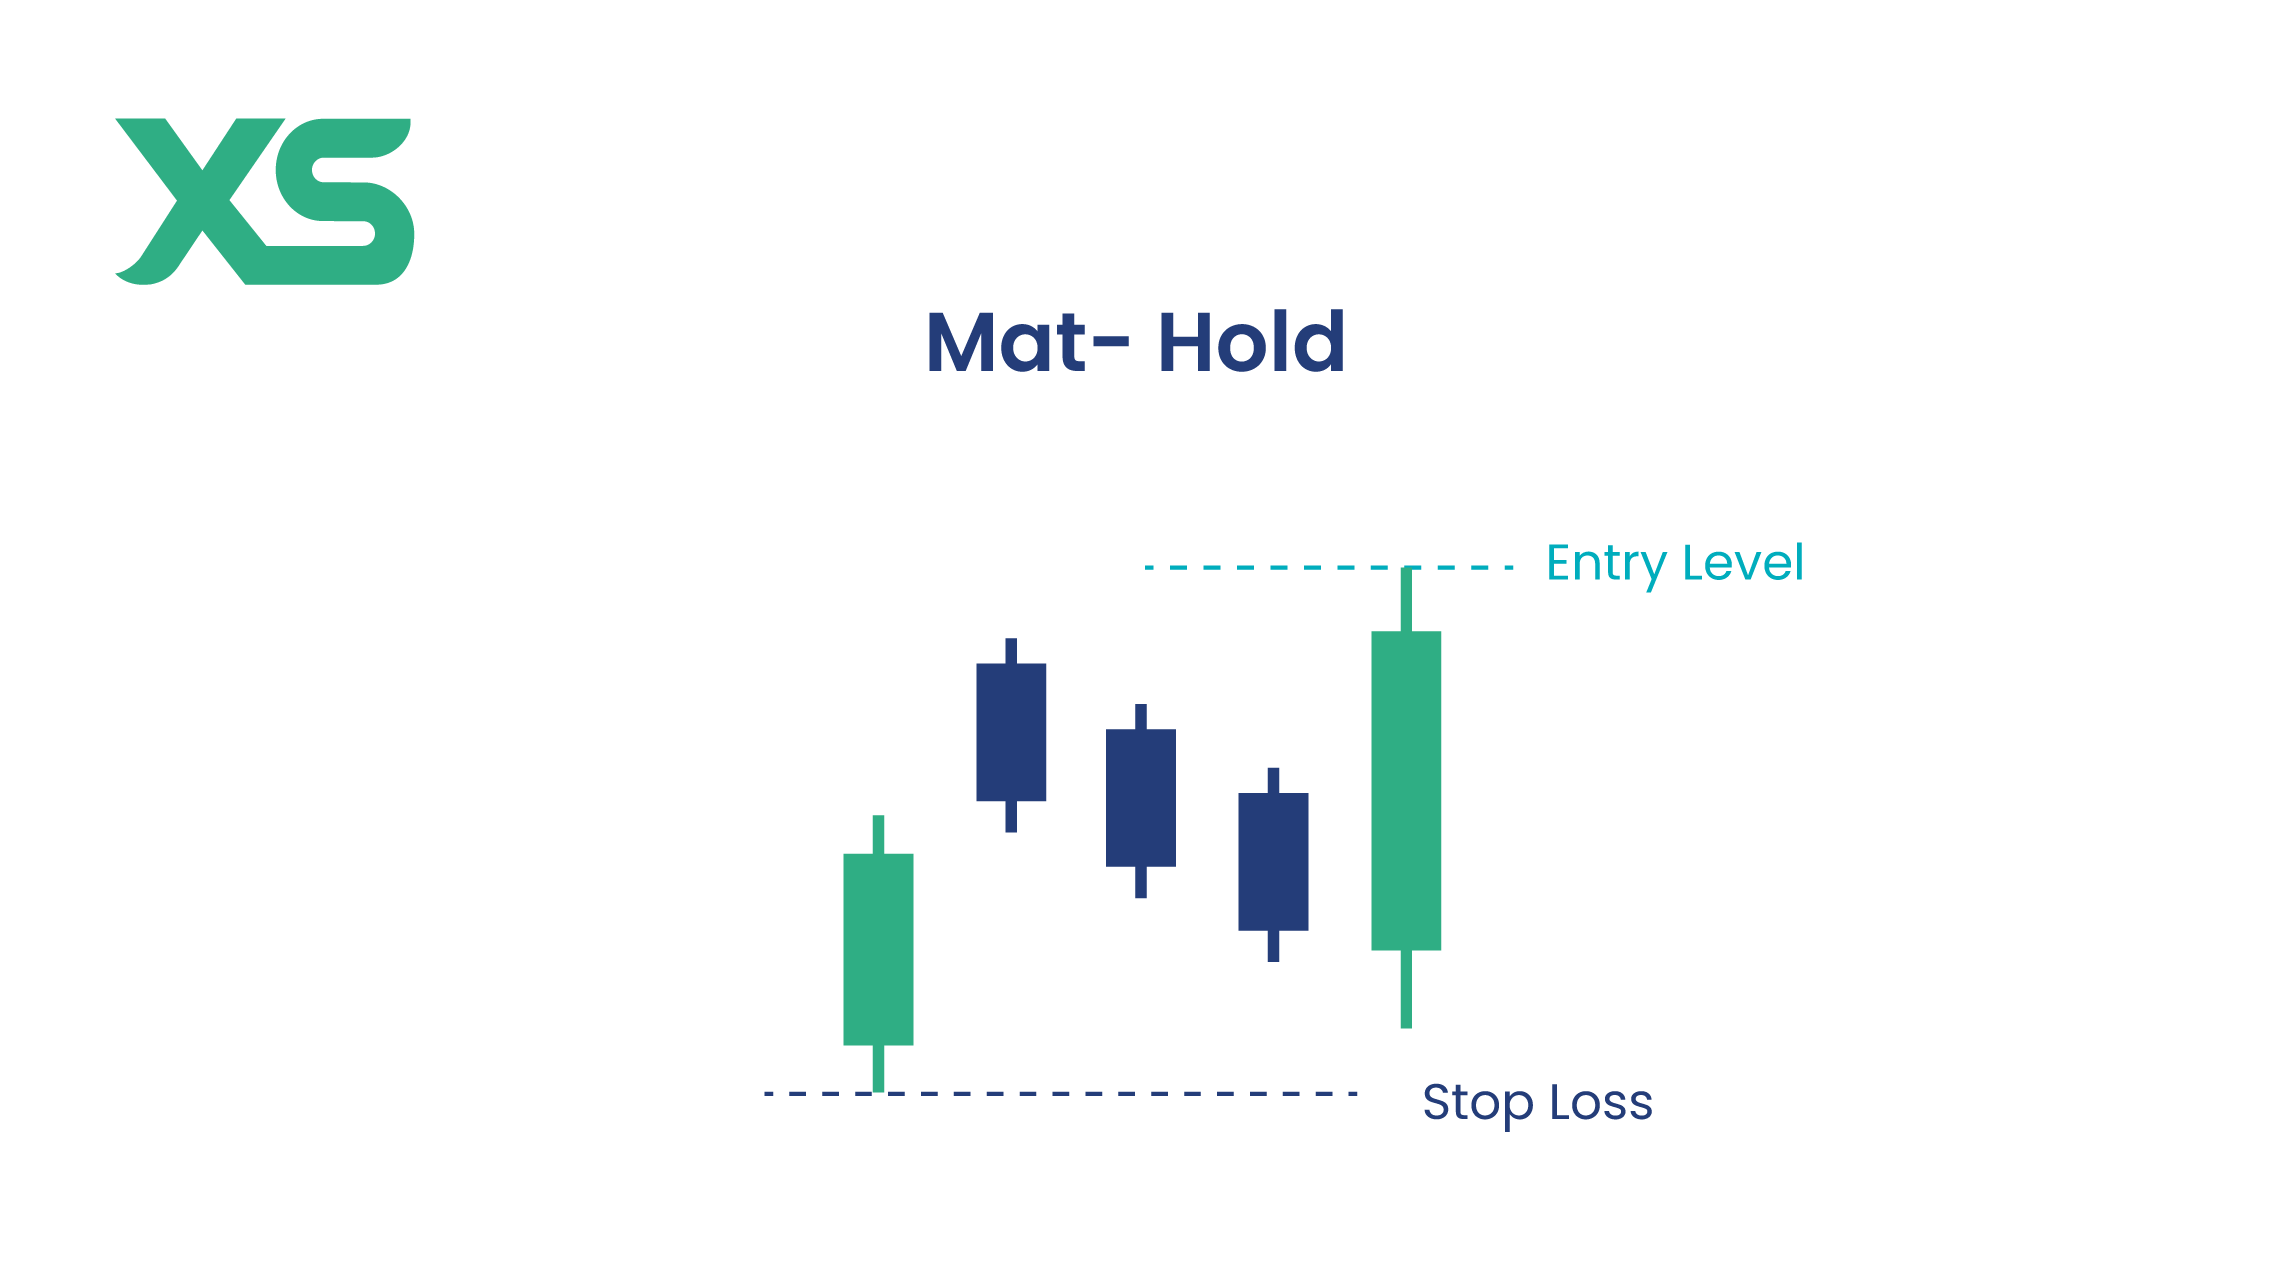
Bullish Mat Hold
The Bullish Mat Hold is a continuation pattern that begins with a strong bullish candle, followed by a few small bearish candles that remain within the range of the first candle. The final candle is a large bullish candle that breaks above the first candle’s high, confirming the continuation of the uptrend.
Key Features:
-
A large bullish candle followed by 2–4 small bearish candles.
-
The last candle is bullish and breaks above the first candle’s high.
-
Signals a strong trend continuation after a brief pullback.
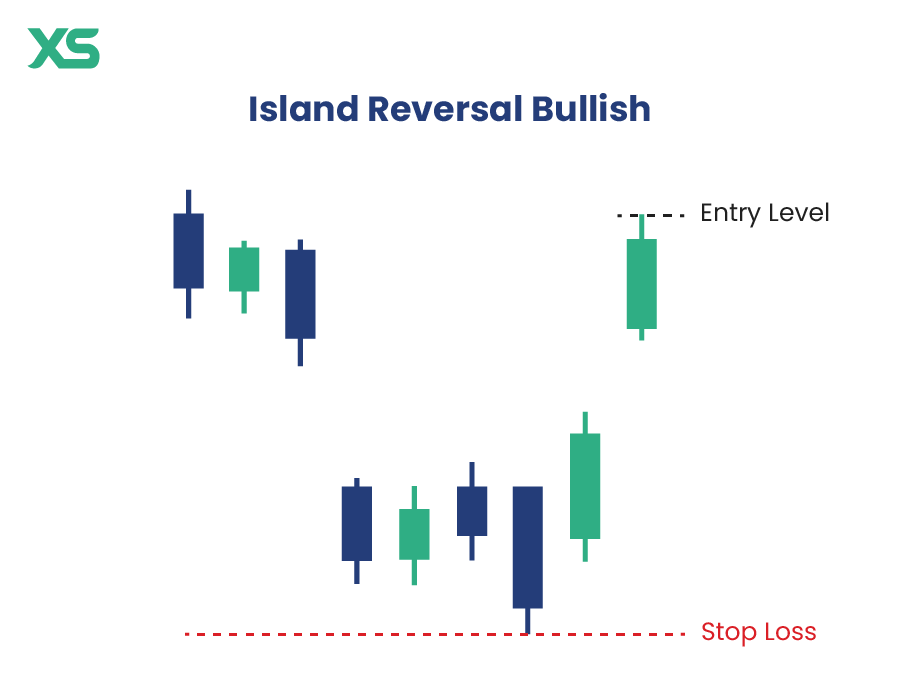
Island Reversal (Bullish)
The Island Reversal is a strong reversal pattern that occurs when a group of candles is isolated by gaps on both sides. It begins with a gap-down, forming a small consolidation period, followed by a gap-up, leaving the previous candles as an "island." This pattern suggests a sharp shift in market sentiment.
Key Features:
-
A cluster of candles is separated by gaps on both sides.
-
Signals a strong reversal, especially when accompanied by high volume.
-
Commonly seen after extreme price movements or news events.
Bullish Belt Hold
The Bullish Belt Hold is a single, long bullish candle that opens at its low and continues to rise throughout the session without forming a lower wick. This pattern indicates strong buying pressure and is often seen as a sign of trend continuation.
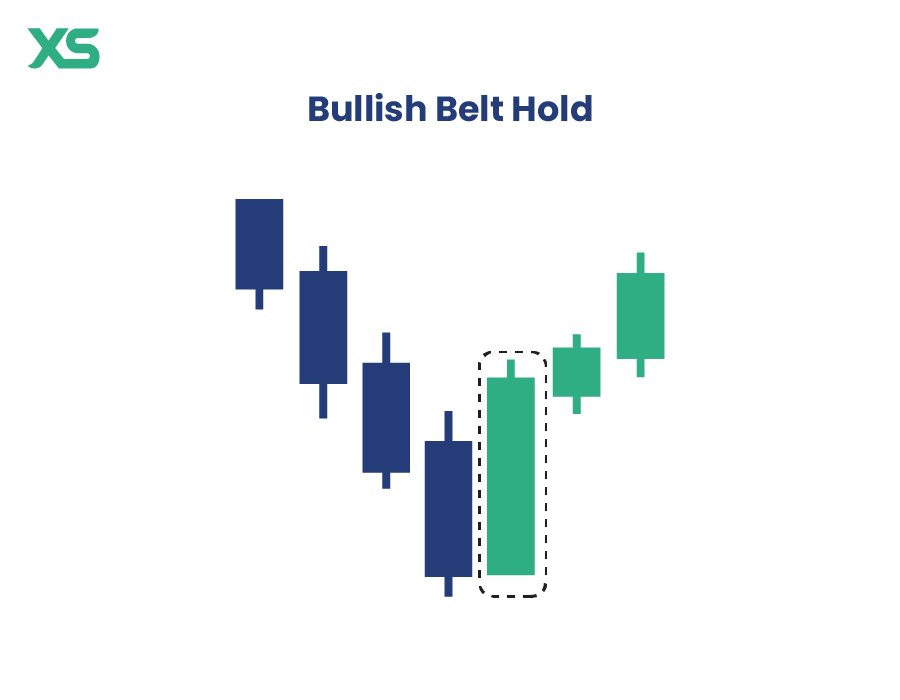
Key Features:
-
A long bullish candle with little to no lower wick.
-
Suggests strong buyer control from the opening price.
- More effective when appearing after a pullback in an uptrend.
How to Use Bullish Candlestick Patterns in Trading?
Bullish candlestick patterns are powerful tools, but they work best when combined with other technical analysis techniques.
Confirm with Technical Indicators
Candlestick patterns become more reliable when paired with technical indicators that validate the trend shift. Some commonly used indicators include:
-
Moving Averages: Bullish patterns forming near the 50-day or 200-day moving average can confirm an uptrend.
-
Relative Strength Index (RSI): An oversold RSI (below 30) alongside a bullish pattern strengthens the reversal signal.
-
MACD Crossover: A bullish MACD crossover can reinforce the pattern’s reliability.
Identify Key Support and Resistance Levels
Bullish candlestick patterns are most effective when they appear at strong support levels—areas where price has historically bounced back. If a pattern forms near a support level, it suggests a higher probability of a price reversal.
For example, a Bullish Engulfing pattern at a key support zone increases the chances of a strong upward move.
Look for Volume Confirmation
Higher trading volume during or after a bullish candlestick pattern indicates stronger conviction from buyers. Low volume may signal a weaker move that could fade quickly.
For example, a Three White Soldiers pattern with rising volume is a strong sign of sustained buying pressure.
Choose the Right Timeframe
The effectiveness of candlestick patterns depends on the timeframe being used:
-
Short-term traders (scalping/day trading): 5-minute or 15-minute charts.
-
Swing traders: 1-hour or 4-hour charts.
-
Long-term investors: Daily or weekly charts
Higher timeframes generally produce more reliable signals than lower ones.
Set Stop-Loss and Take-Profit Levels
To manage risk effectively, traders should set stop-loss and take-profit levels when trading bullish patterns:
-
Stop-loss: Below the low of the bullish pattern to minimize losses if the trade goes against you.
-
Take-profit: Based on previous resistance levels or Fibonacci extensions.
Conclusion
Bullish candlestick patterns help traders spot potential price increases and better time their trades. While these patterns can be useful, they work best when combined with other indicators like support and resistance levels or volume. Practicing with different patterns and timeframes can improve trading decisions and help traders navigate the market more confidently in 2025.

Get the latest insights & exclusive offers delivered straight to your inbox.
Table of Contents

Start Your Journey
Put your knowledge into action by opening an XS trading account today
FAQs
Use technical indicators like RSI, MACD, moving averages, and volume analysis to confirm the strength of the bullish signal.
Patterns like Bullish Engulfing, Morning Star, and Three White Soldiers are considered highly reliable, especially with volume confirmation.
Yes, they work in stocks, forex, crypto, and commodities, but their effectiveness depends on volume, market conditions, and timeframes.
No pattern guarantees success, but they increase the probability of a price rise when used with other technical analysis tools.
Higher timeframes (daily or 4-hour) offer stronger signals, while lower timeframes (15-minute, 1-hour) work better for short-term traders.


Sarah Abbas
SEO content writer
Sarah Abbas is an SEO content writer with close to two years of experience creating educational content on finance and trading. Sarah brings a unique approach by combining creativity with clarity, transforming complex concepts into content that's easy to grasp.

This written/visual material is comprised of personal opinions and ideas and may not reflect those of the Company. The content should not be construed as containing any type of investment advice and/or a solicitation for any transactions. It does not imply an obligation to purchase investment services, nor does it guarantee or predict future performance. XS, its affiliates, agents, directors, officers or employees do not guarantee the accuracy, validity, timeliness or completeness of any information or data made available and assume no liability for any loss arising from any investment based on the same. Our platform may not offer all the products or services mentioned.
Start Your Journey
Put your knowledge into action by opening an XS trading account today
